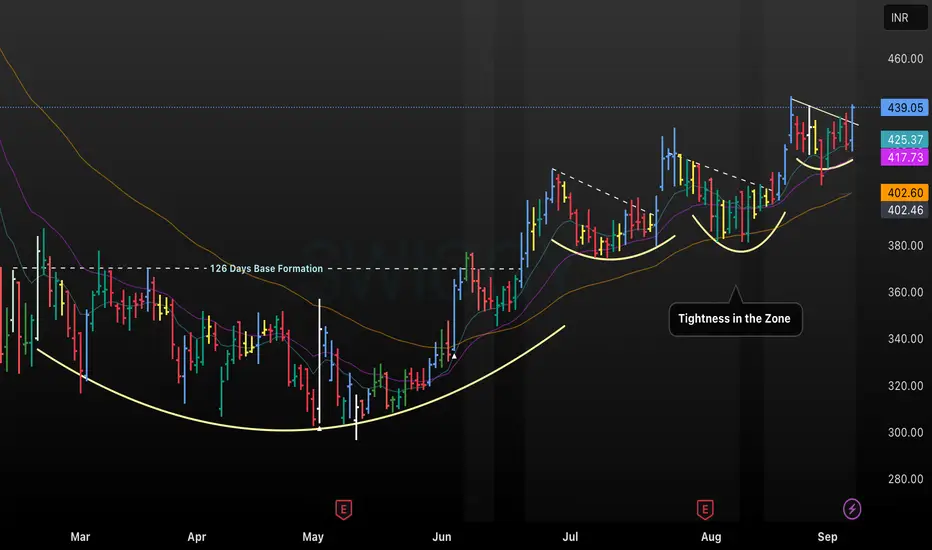
This chart analyzes SWIGGY’s recent price action and technical setup, featuring a 126-day base formation as a foundation for trend reversal and bullish momentum. The stock has shown consistent upward movement, supported by tightening in the zone and well-defined moving average support, with resistance levels around 439.05 INR. Tightness in the trend zone indicates buyer accumulation, increasing the probability of a sustained breakout following the consolidation phase and moving average alignment
إخلاء المسؤولية
لا يُقصد بالمعلومات والمنشورات أن تكون، أو تشكل، أي نصيحة مالية أو استثمارية أو تجارية أو أنواع أخرى من النصائح أو التوصيات المقدمة أو المعتمدة من TradingView. اقرأ المزيد في شروط الاستخدام.
إخلاء المسؤولية
لا يُقصد بالمعلومات والمنشورات أن تكون، أو تشكل، أي نصيحة مالية أو استثمارية أو تجارية أو أنواع أخرى من النصائح أو التوصيات المقدمة أو المعتمدة من TradingView. اقرأ المزيد في شروط الاستخدام.