26-Jul
Stock price trend forecast timing analysis.
See a forecast candlestick chart of 10 days in the future: pretiming.com/search?q=T
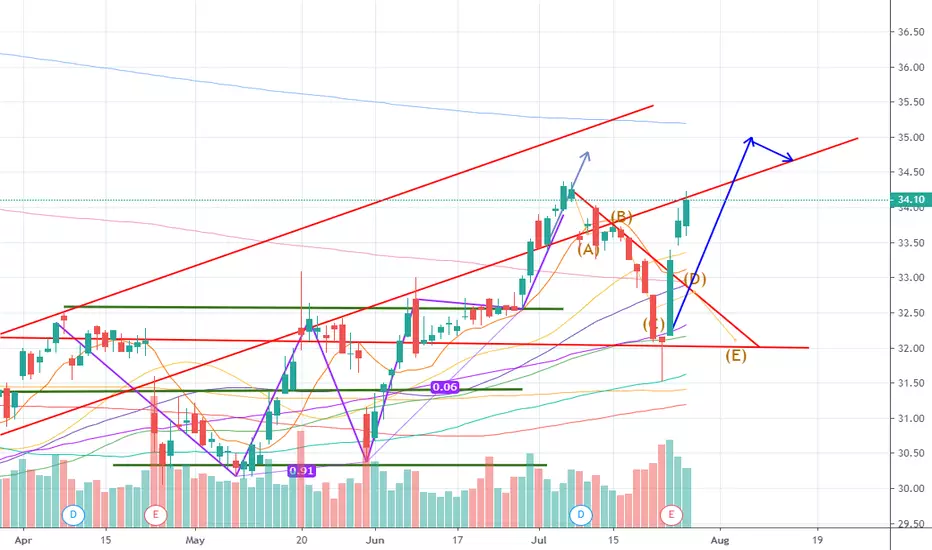
Investing position: In Rising section of high profit & low risk
Supply-Demand(S&D) strength Trend: In the midst of an upward trend of strong upward momentum price flow marked by the temporary falls and strong rises.
Today's Supply-Demand(S&D) strength Flow: Supply-Demand strength has changed from a weak buying flow to a strengthening buying flow again.
Forecast D+1 Candlestick Color : GREEN Candlestick
%D+1 Range forecast: 0.9% (HIGH) ~ -0.5% (LOW), 0.3% (CLOSE)
%AVG in case of rising: 1.3% (HIGH) ~ -0.2% (LOW), 0.9% (CLOSE)
%AVG in case of falling: 0.3% (HIGH) ~ -1.1% (LOW), -0.6% (CLOSE)
Stock price trend forecast timing analysis.
See a forecast candlestick chart of 10 days in the future: pretiming.com/search?q=T
Investing position: In Rising section of high profit & low risk
Supply-Demand(S&D) strength Trend: In the midst of an upward trend of strong upward momentum price flow marked by the temporary falls and strong rises.
Today's Supply-Demand(S&D) strength Flow: Supply-Demand strength has changed from a weak buying flow to a strengthening buying flow again.
Forecast D+1 Candlestick Color : GREEN Candlestick
%D+1 Range forecast: 0.9% (HIGH) ~ -0.5% (LOW), 0.3% (CLOSE)
%AVG in case of rising: 1.3% (HIGH) ~ -0.2% (LOW), 0.9% (CLOSE)
%AVG in case of falling: 0.3% (HIGH) ~ -1.1% (LOW), -0.6% (CLOSE)
إخلاء المسؤولية
The information and publications are not meant to be, and do not constitute, financial, investment, trading, or other types of advice or recommendations supplied or endorsed by TradingView. Read more in the Terms of Use.
إخلاء المسؤولية
The information and publications are not meant to be, and do not constitute, financial, investment, trading, or other types of advice or recommendations supplied or endorsed by TradingView. Read more in the Terms of Use.