19-JUL
pretiming.com/2019/04/at-nyse-t-stock-price-forecast-timing.html
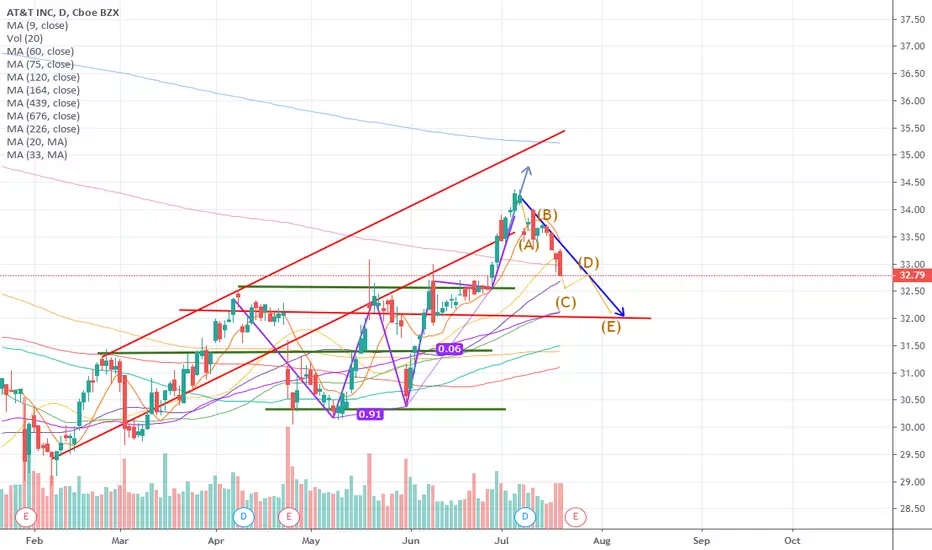
Investing position: In Falling section of high risk & low profit
S&D strength Trend: In the midst of a downward trend of strong downward momentum price flow marked by temporary rises and strong falls.
Today's S&D strength Flow: Supply-Demand strength has changed from a weak selling flow to a strengthening selling flow again.
Forecast D+1 Candlestick Color : RED Candlestick
%D+1 Range forecast: 0.5% (HIGH) ~ -0.6% (LOW), -0.1% (CLOSE)
%AVG in case of rising: 1.0% (HIGH) ~ -0.4% (LOW), 0.6% (CLOSE)
%AVG in case of falling: 0.3% (HIGH) ~ -1.1% (LOW), -0.8% (CLOSE)
pretiming.com/2019/04/at-nyse-t-stock-price-forecast-timing.html
Investing position: In Falling section of high risk & low profit
S&D strength Trend: In the midst of a downward trend of strong downward momentum price flow marked by temporary rises and strong falls.
Today's S&D strength Flow: Supply-Demand strength has changed from a weak selling flow to a strengthening selling flow again.
Forecast D+1 Candlestick Color : RED Candlestick
%D+1 Range forecast: 0.5% (HIGH) ~ -0.6% (LOW), -0.1% (CLOSE)
%AVG in case of rising: 1.0% (HIGH) ~ -0.4% (LOW), 0.6% (CLOSE)
%AVG in case of falling: 0.3% (HIGH) ~ -1.1% (LOW), -0.8% (CLOSE)
إخلاء المسؤولية
لا يُقصد بالمعلومات والمنشورات أن تكون، أو تشكل، أي نصيحة مالية أو استثمارية أو تجارية أو أنواع أخرى من النصائح أو التوصيات المقدمة أو المعتمدة من TradingView. اقرأ المزيد في شروط الاستخدام.
إخلاء المسؤولية
لا يُقصد بالمعلومات والمنشورات أن تكون، أو تشكل، أي نصيحة مالية أو استثمارية أو تجارية أو أنواع أخرى من النصائح أو التوصيات المقدمة أو المعتمدة من TradingView. اقرأ المزيد في شروط الاستخدام.