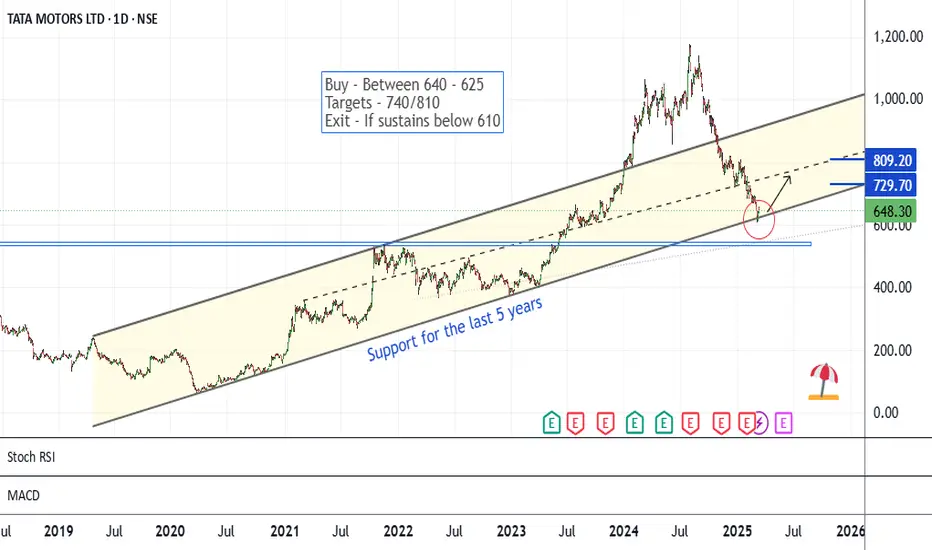
The chart is self-explanatory. The price has been travelling in a higher high-higher low pattern for the last 5 years. This time comes to the lower levels.
In the recent 5-6 sessions, it has shown a bounce back.
If momentum continues, a bullish move may be seen ahead.
The risk-reward ratio is quite good for positional trading at these levels.
If it sustains below 610 levels on a closing basis for 2-3 days, the setup will lose significance.
All these illustrations are only for learning and sharing purposes; it is not a buy or sell recommendation.
All the best.
ملاحظة
Showed some strength in the 12th March session. Crossed 670. Let's look ahead.تم فتح الصفقة
Showed good momentum today. Crossing 692. Keep on Watch.ملاحظة
Crossed 715 on 24.03.25.إخلاء المسؤولية
لا يُقصد بالمعلومات والمنشورات أن تكون، أو تشكل، أي نصيحة مالية أو استثمارية أو تجارية أو أنواع أخرى من النصائح أو التوصيات المقدمة أو المعتمدة من TradingView. اقرأ المزيد في شروط الاستخدام.
إخلاء المسؤولية
لا يُقصد بالمعلومات والمنشورات أن تكون، أو تشكل، أي نصيحة مالية أو استثمارية أو تجارية أو أنواع أخرى من النصائح أو التوصيات المقدمة أو المعتمدة من TradingView. اقرأ المزيد في شروط الاستخدام.