⚡ Tata Power – Bullish Reversal Pattern on Daily Chart
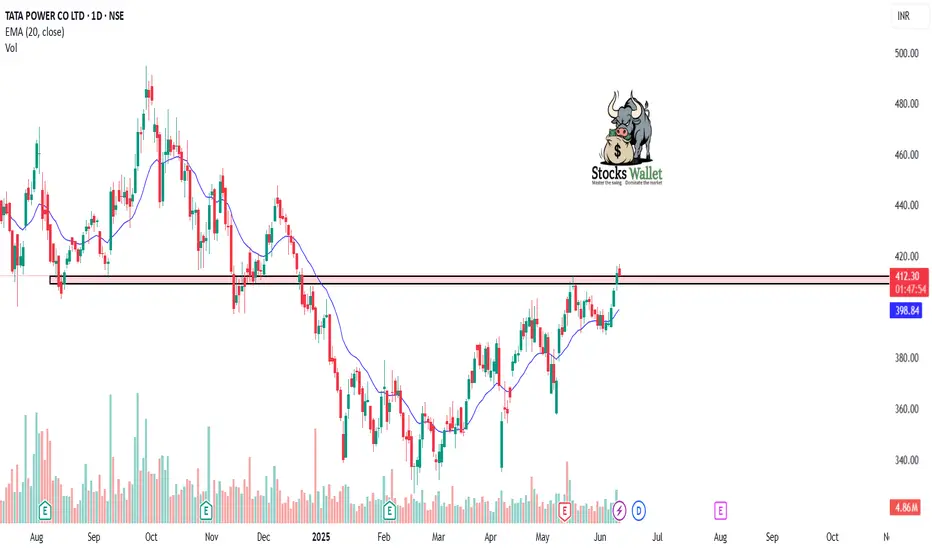
Chart: Tata Power – Daily Timeframe
Tata Power has formed a strong bullish reversal setup after retesting a key support zone near ₹420. The stock has shown strong buying interest with rising volume and a bullish engulfing candle, indicating a potential start of a new upward leg.
🔹 Technical Highlights:
Price bounced from previous swing support (₹420–₹425)
Bullish engulfing candle + volume surge = strong buyer presence
RSI reversing from 50 zone and trending upward
20 EMA acting as dynamic support
📌 Trade Plan:
Entry Zone: ₹430–435
Target 1: ₹450
Target 2: ₹470
Stop Loss: Below ₹420 (closing basis)
The broader trend remains positive, and this could be the beginning of a new up-move. A breakout above ₹440 on strong volume would further confirm the bullish trend continuation.
⚠️ This analysis is for educational purposes only. Please do your own research before trading.
إخلاء المسؤولية
لا يُقصد بالمعلومات والمنشورات أن تكون، أو تشكل، أي نصيحة مالية أو استثمارية أو تجارية أو أنواع أخرى من النصائح أو التوصيات المقدمة أو المعتمدة من TradingView. اقرأ المزيد في شروط الاستخدام.
إخلاء المسؤولية
لا يُقصد بالمعلومات والمنشورات أن تكون، أو تشكل، أي نصيحة مالية أو استثمارية أو تجارية أو أنواع أخرى من النصائح أو التوصيات المقدمة أو المعتمدة من TradingView. اقرأ المزيد في شروط الاستخدام.