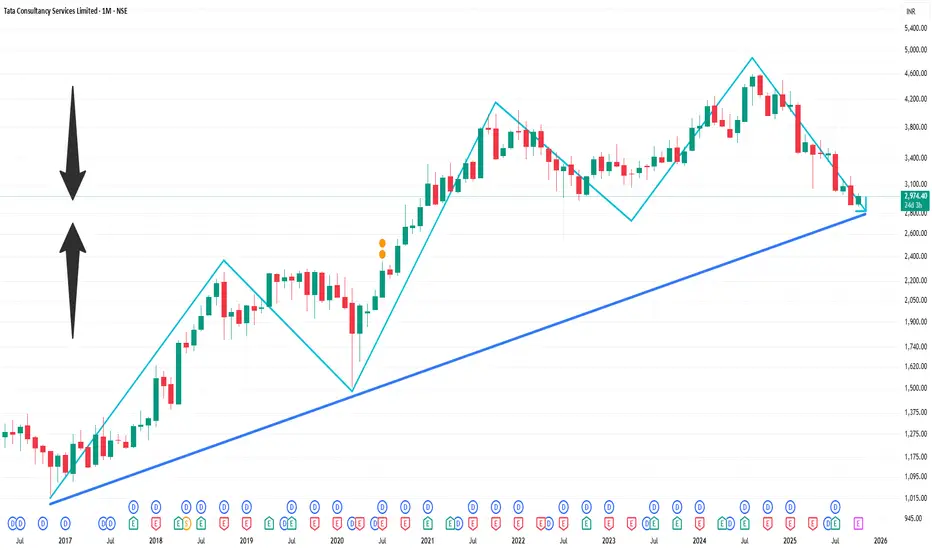
📉 Technical Overview (1-Month Timeframe)
Price Range: ₹2,867.55 – ₹3,202.95
Current Price: ₹2,962.
Trend: Bearish
According to TradingView, the 1-month technical analysis for TCS indicates a neutral outlook. However, moving averages suggest a strong sell signal. Oscillators are neutral, and pivot points are not specified.
🔍 Key Technical Indicators
Relative Strength Index (RSI): Not specified.
Moving Averages: Short-term and long-term moving averages indicate a bearish trend.
MACD: Not specified.
Pivot Points: Not specified.
🔮 Short-Term Outlook
Analysts forecast that TCS may reach ₹2,953.43 within a week and ₹2,707.65 within four weeks.
⚠️ Conclusion
The current technical indicators suggest a bearish trend for TCS over the past month. Investors should exercise caution and consider these factors when making investment decisions.
منشورات ذات صلة
إخلاء المسؤولية
لا يُقصد بالمعلومات والمنشورات أن تكون، أو تشكل، أي نصيحة مالية أو استثمارية أو تجارية أو أنواع أخرى من النصائح أو التوصيات المقدمة أو المعتمدة من TradingView. اقرأ المزيد في شروط الاستخدام.
منشورات ذات صلة
إخلاء المسؤولية
لا يُقصد بالمعلومات والمنشورات أن تكون، أو تشكل، أي نصيحة مالية أو استثمارية أو تجارية أو أنواع أخرى من النصائح أو التوصيات المقدمة أو المعتمدة من TradingView. اقرأ المزيد في شروط الاستخدام.