Current Situation: 📉
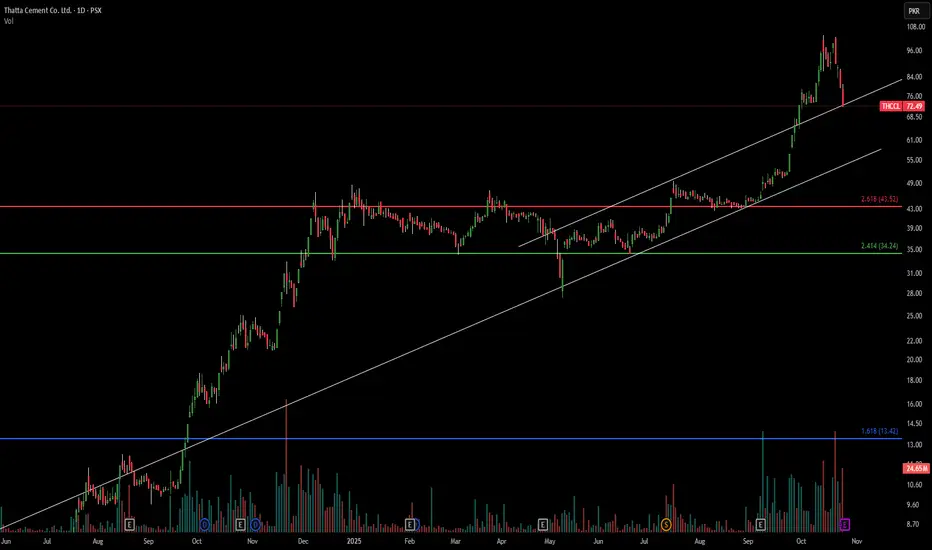
Price: 72.49 PKR, down 9.35% (significant drop!)
MAJOR BREAKDOWN IN PROGRESS - This is a critical technical event! ⚠️
Key Technical Observations: 🔍
Trend Structure:
Beautiful uptrend from June 2024 to October 2025 ✅
Massive parabolic rally from 50 to 108 (116% gain!) 🚀
NOW: Sharp reversal and breakdown from highs 💥
Price broke below the white ascending trendline support 📉
Fibonacci Extension Levels:
2.618 (43.52): Extended target (not reached)
2.414 (34.24): Secondary extension
1.618 (13.42): Base extension from earlier rally
Critical Support/Resistance: 🎯
Resistance (Now turned into overhead supply):
Immediate: 76-78 (broken trendline + previous support)
Strong: 84-88 (gap fill zone)
Major: 95-100 (psychological level)
Massive: 105-108 (recent highs - unlikely to revisit soon) 🔴
Support:
Current battle: 70-72 (attempting to hold) ⚔️
Critical: 60-65 (major support zone + gap support) 🛡️
Strong: 52-55 (pre-breakout consolidation)
Major: 43-45 (2.618 Fib extension + historical resistance) 💪
Volume Analysis: 📊
MASSIVE volume spike on the breakdown day (circled in purple) - Classic distribution! 🚨
Previous volume spikes throughout the rally (circled in orange/blue)
Today's volume at 24.68M is extremely elevated - Panic selling detected! 😰
Pattern Recognition: 📐
Parabolic blow-off top - Classic exhaustion pattern 💨
Potential gap down creating overhead resistance
Break of multi-month ascending trendline (white line) ⚠️
This looks like a "climax top" pattern
Technical Outlook: 🎲
Bearish Scenario (HIGH Probability - 75%): 🐻
Gap down with massive volume = Strong distribution
Expect further downside to 60-65 zone (-15% from here) 📉
If 60 breaks, next stop: 52-55 (-25% from here) 😬
Worst case: Full retracement to 43-45 zone 💀
Neutral Scenario (Medium Probability - 20%): 😐
Finds support at 68-70 and forms a base
Choppy consolidation for several weeks
Needs to reclaim 78-80 to stabilize ⚡
Bullish Scenario (LOW Probability - 5%): 🐂
Immediate V-shaped recovery above 78-80 (unlikely given volume)
Would need massive buying volume to negate this breakdown 🤷♂️
Trading Strategy: 💡
For Current Holders: 😰
RISK ALERT: Major technical damage done! 🚨
Consider cutting losses if breaks below 68-70 decisively
Stop loss: 67 (limit further damage) 🛑
This could be a 20-30% correction scenario
For Buyers: 🤔
DO NOT catch the falling knife! 🔪
Wait for stabilization and basing pattern
First entry opportunity: 60-65 zone (if reached with calming volume) ✅
Better entry: 52-55 zone (safer, more attractive R:R) 💰
Best entry: 43-45 zone (if we get a full retracement - high reward!) 🎁
For Traders: 📈
Short-term bounce possible to 76-78 (dead cat bounce?) 🐱
Any bounce is a selling opportunity until structure improves
Watch for lower highs and lower lows pattern 📉
Key Signals to Watch: 👀
Volume normalization (needs to dry up) 💧
Stabilization above 68-70 for 3-5 days ⏰
Reclaim of 78-80 with volume (trend change signal) 🔄
Risk Assessment: ⚖️
🔴 HIGH RISK ZONE 🔴
Parabolic moves up = parabolic moves down
The bigger the rally, the harder they fall 💥
This stock went up 116% in ~15 months - expect 30-50% retracement
Sentiment has shifted from greed to fear 😱
Bottom Line: 🎯
This is a textbook breakdown from a parabolic rally. The massive volume confirms institutional selling. Stay on the sidelines until the dust settles. Patience will be rewarded with better entry prices! 🧘♂️
منشورات ذات صلة
إخلاء المسؤولية
لا يُقصد بالمعلومات والمنشورات أن تكون، أو تشكل، أي نصيحة مالية أو استثمارية أو تجارية أو أنواع أخرى من النصائح أو التوصيات المقدمة أو المعتمدة من TradingView. اقرأ المزيد في شروط الاستخدام.
إخلاء المسؤولية
لا يُقصد بالمعلومات والمنشورات أن تكون، أو تشكل، أي نصيحة مالية أو استثمارية أو تجارية أو أنواع أخرى من النصائح أو التوصيات المقدمة أو المعتمدة من TradingView. اقرأ المزيد في شروط الاستخدام.