Inverse H&S Forming on Daily TF – Price Testing Resistance Trendline. What’s Next?
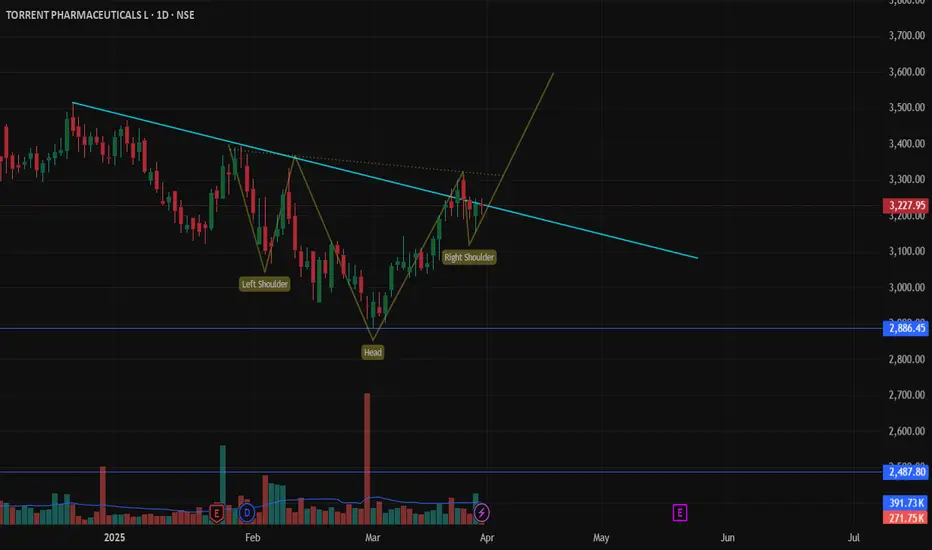
An Inverse Head & Shoulders (H&S) pattern is taking shape on the daily chart, suggesting a potential bullish reversal. Price is now testing a key resistance trendline—will it break through?
🔹 Bullish Confirmation: A breakout above resistance could confirm the pattern, targeting higher levels.
🔹 Bearish Rejection: If price gets rejected, the setup may fail, leading to a retest of nearest support.
Key Levels: Neckline (resistance) & trendline breakout zone. Thoughts? #PriceAction #TradingSetup
إخلاء المسؤولية
لا يُقصد بالمعلومات والمنشورات أن تكون، أو تشكل، أي نصيحة مالية أو استثمارية أو تجارية أو أنواع أخرى من النصائح أو التوصيات المقدمة أو المعتمدة من TradingView. اقرأ المزيد في شروط الاستخدام.
إخلاء المسؤولية
لا يُقصد بالمعلومات والمنشورات أن تكون، أو تشكل، أي نصيحة مالية أو استثمارية أو تجارية أو أنواع أخرى من النصائح أو التوصيات المقدمة أو المعتمدة من TradingView. اقرأ المزيد في شروط الاستخدام.