Alts Market Cap (#ALTS) Weekly Chart Update & Analysis
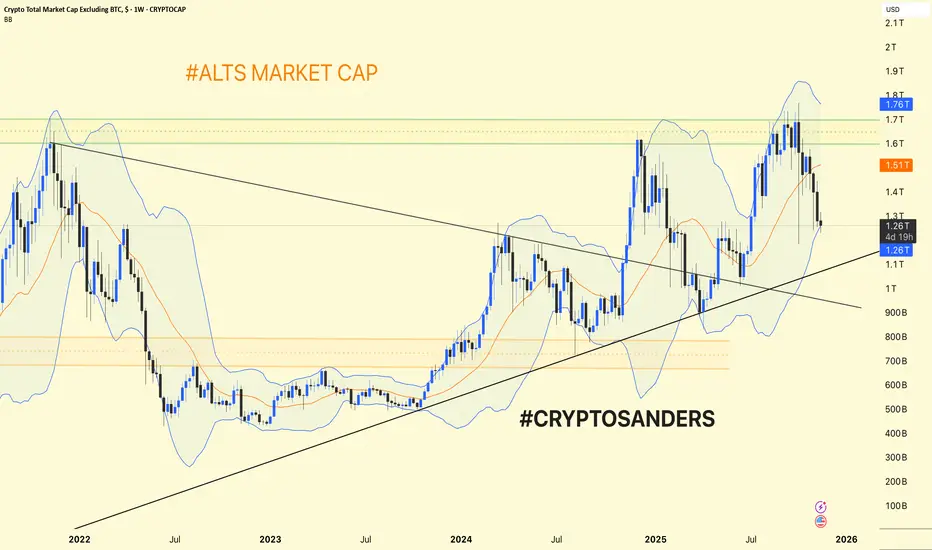
Trend Structure: The altcoin market cap (total crypto market cap excluding BTC) is trading within a broad uptrend channel after a major breakout in early 2024.
Support is currently found near $1.25T (recent swing low and channel support).
Resistance remains around $1.51T (orange line) and $1.76T (major horizontal/upper Bollinger Band zone).
Bollinger Bands: The chart uses weekly Bollinger Bands—price has pulled back from the upper band ($1.76T) and is now holding the midline ($1.26T) as short-term support.
A successful hold above $1.25T keeps the uptrend intact and sets the stage for a move back to $1.51–$1.76T.
A breakdown could lead to a deeper dip toward the long-term rising trendline (currently around $1T).
Alts are consolidating at higher lows inside an uptrend. Holding above the $1.25T area signals strength; a break above $1.51T confirms fresh upside momentum, while losing $1.25T would signal caution for further corrections.
DYOR | NFA
منشورات ذات صلة
إخلاء المسؤولية
لا يُقصد بالمعلومات والمنشورات أن تكون، أو تشكل، أي نصيحة مالية أو استثمارية أو تجارية أو أنواع أخرى من النصائح أو التوصيات المقدمة أو المعتمدة من TradingView. اقرأ المزيد في شروط الاستخدام.
منشورات ذات صلة
إخلاء المسؤولية
لا يُقصد بالمعلومات والمنشورات أن تكون، أو تشكل، أي نصيحة مالية أو استثمارية أو تجارية أو أنواع أخرى من النصائح أو التوصيات المقدمة أو المعتمدة من TradingView. اقرأ المزيد في شروط الاستخدام.