Transrail Light - An analysis
Fundamental Outlook
Market Cap : INR 8400 cr
D/E ratio is 0.34, down from 0.59 in previous quarter
Manageable ICR 3.36, up from 2.3 in previous quarter
PE of 25.6, IND PE is 55.68, ~0.5X of Industry PE, inexpensive stock amongst Industry peers
PEG of 0.96, Excellent
ROE = 21.63%
ROCE = 30.58% , ROCE 5yrs = 28.82%
Sales growth = 30.2%, Sales Growth 5 yrs =23.06%
Profit growth = 41.95%, Profit Growth 5 yrs = 26.71%
Promoter holding at 71.12%, stable since IPO in Dec 24
Cumulative FII/DII holding above 14%
Public holding < 15%
Sales and Profits have increased QoQ for the last 3 quarters
Sales and profits have increased on YoY for last 3 years too
Technical Outlook
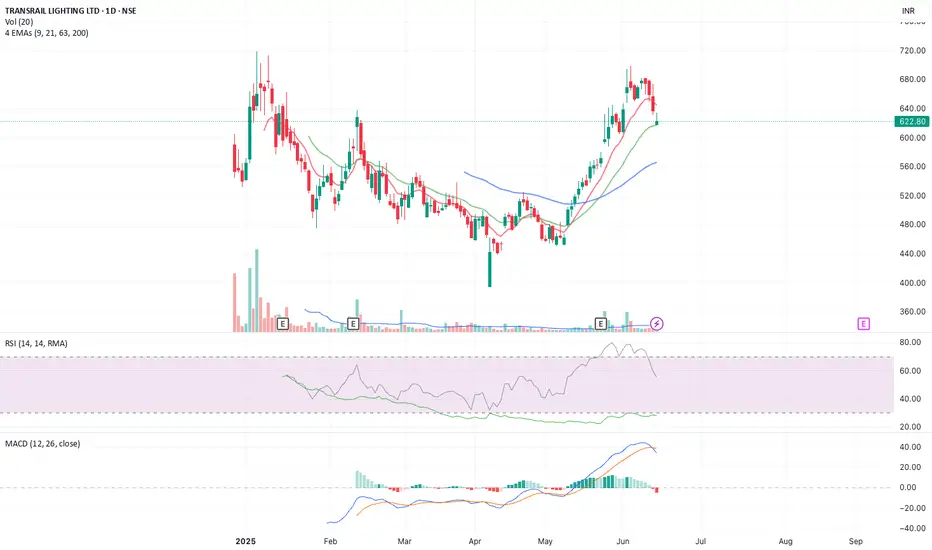
CMP : 623
On daily charts ,
Stock has experienced a significant downtrend and has bounced back to Near ATH level of 675-680.
It has fallen down in this past week and is available attractively near EMA 21 levels
RSI(weekly)=57
RSI(daily) =55
On daily charts
LTP > EMA21 > EMA63
RSI(daily) =55
Chart Patterns
On weekly charts ,
Stock seems to have formed a rounding bottom pattern.
Industry Outlook
Sector/Industry - Capital Goods/Heavy Electrical Equipment
Transrail has been on of the best performance amongst its peers in this category and has significantly outperformed bigger (by MCAP) peers like ABB, CGPOWER and BHEL
Relative strength and momentum on 20 day time period is weakening.
RS = 116, relatively strong strength compared to Nifty 500
Momentum = 98, relatively less momentum compared to Nifty 500
Starting to weaken, dips will be good investing opportunity
Management Guidance and Things to look forward to in next quarter
- Management guided 23-25% revenue growth over its FY25 performance. 40% in H1 and remaining 60% in H2.
- EBITDA margin of 12-12.25% in FY26, PAT margin around 6%
- Continued debt reduction
- Capex progression and completion in FY26
Future Outlook
- PE at 35-36x from current 25x levels
Disclosure 1 - Not Invested
Disclosure 2 - Not SEBI Registered
Disclosure 3 - This is Not investment advice. Treat it as educational
Fundamental Outlook
Market Cap : INR 8400 cr
D/E ratio is 0.34, down from 0.59 in previous quarter
Manageable ICR 3.36, up from 2.3 in previous quarter
PE of 25.6, IND PE is 55.68, ~0.5X of Industry PE, inexpensive stock amongst Industry peers
PEG of 0.96, Excellent
ROE = 21.63%
ROCE = 30.58% , ROCE 5yrs = 28.82%
Sales growth = 30.2%, Sales Growth 5 yrs =23.06%
Profit growth = 41.95%, Profit Growth 5 yrs = 26.71%
Promoter holding at 71.12%, stable since IPO in Dec 24
Cumulative FII/DII holding above 14%
Public holding < 15%
Sales and Profits have increased QoQ for the last 3 quarters
Sales and profits have increased on YoY for last 3 years too
Technical Outlook
CMP : 623
On daily charts ,
Stock has experienced a significant downtrend and has bounced back to Near ATH level of 675-680.
It has fallen down in this past week and is available attractively near EMA 21 levels
RSI(weekly)=57
RSI(daily) =55
On daily charts
LTP > EMA21 > EMA63
RSI(daily) =55
Chart Patterns
On weekly charts ,
Stock seems to have formed a rounding bottom pattern.
Industry Outlook
Sector/Industry - Capital Goods/Heavy Electrical Equipment
Transrail has been on of the best performance amongst its peers in this category and has significantly outperformed bigger (by MCAP) peers like ABB, CGPOWER and BHEL
Relative strength and momentum on 20 day time period is weakening.
RS = 116, relatively strong strength compared to Nifty 500
Momentum = 98, relatively less momentum compared to Nifty 500
Starting to weaken, dips will be good investing opportunity
Management Guidance and Things to look forward to in next quarter
- Management guided 23-25% revenue growth over its FY25 performance. 40% in H1 and remaining 60% in H2.
- EBITDA margin of 12-12.25% in FY26, PAT margin around 6%
- Continued debt reduction
- Capex progression and completion in FY26
Future Outlook
- PE at 35-36x from current 25x levels
Disclosure 1 - Not Invested
Disclosure 2 - Not SEBI Registered
Disclosure 3 - This is Not investment advice. Treat it as educational
تم فتح الصفقة
CMP 760 after major highs in the past weeks/month. View unchangedإخلاء المسؤولية
لا يُقصد بالمعلومات والمنشورات أن تكون، أو تشكل، أي نصيحة مالية أو استثمارية أو تجارية أو أنواع أخرى من النصائح أو التوصيات المقدمة أو المعتمدة من TradingView. اقرأ المزيد في شروط الاستخدام.
إخلاء المسؤولية
لا يُقصد بالمعلومات والمنشورات أن تكون، أو تشكل، أي نصيحة مالية أو استثمارية أو تجارية أو أنواع أخرى من النصائح أو التوصيات المقدمة أو المعتمدة من TradingView. اقرأ المزيد في شروط الاستخدام.