#### **Current Price and Recent Movement**
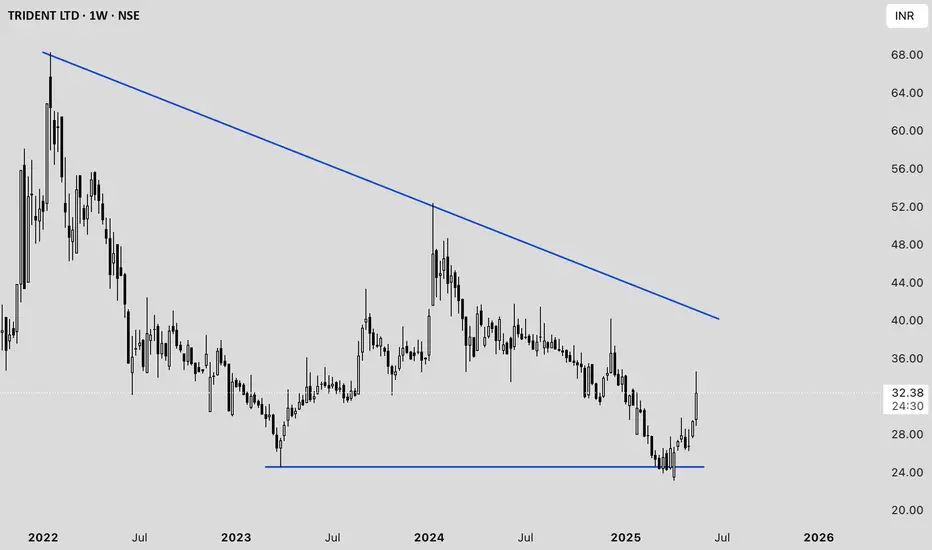
- **Latest Price:** ₹32.11 (down 2.32% from the previous close)[1].
- **1-Week Return:** +9.29%
- **1-Month Return:** +9.11%
- **1-Year Return:** -15.39%
- **3-Year Return:** -32.89%[1]
#### **Technical Analysis**
- **Buy Signal:** A 200-day moving average crossover occurred on May 21, 2025. Historically, this signal has led to an average gain of 6.61% within 30 days[1].
- **Momentum Indicators:**
- **RSI:** 62.17 (shows moderate bullish momentum)[5]
- **MACD:** 0.535 (bullish signal)[5]
- **Stochastic:** 75.40 (approaching overbought zone)[5]
- **Supertrend:** 26.03 (bullish)[5]
- **ROC:** 10.87 (positive momentum)[5]
- **Analyst Sentiment:** 100% of analysts currently recommend a "Buy" with an average target price of ₹38, indicating a potential upside of ~15.6%[2].
#### **Fundamental Overview**
- **P/E Ratio:** 44.50–45.65 (well below the industry average of 126.09, but still high relative to earnings growth)[1][2][4]
- **Price-to-Book Ratio:** 3.62–3.88[1][4]
- **Dividend:** Announced ₹0.5 per share (record date: May 27, 2025)[1].
- **Net Profit Margin:** 5.78% (FY24)[3]
- **Return on Equity:** 9.04% (FY24)[3]
- **Debt/Equity:** 0.48 (moderate leverage)[3]
- **Intrinsic Value Estimate:** ₹9.73 (suggests current price is at a premium to intrinsic value)[4]
#### **Recent Financial Performance**
- **Q3 FY25 Revenue:** ₹1,667.09 crore (down 9.17% YoY)[3]
- **Profitability:** Net profit/share for FY24 was ₹0.76, down from ₹0.83 in FY23[3]
- **Expense Management:** Interest expense is low at 1.86% of operating revenue; employee cost is 13.2%[1]
#### **Strengths**
- Strong technical momentum and recent bullish crossover.
- Consistent dividend payout.
- Low interest expense and moderate leverage.
#### **Weaknesses**
- Declining revenue and profit over the last few quarters.
- High valuation relative to earnings and intrinsic value.
- Long-term returns have been negative over 1 and 3 years.
#### **Outlook**
Analysts remain bullish in the short term, buoyed by technical signals and an expected price target of ₹38[2]. However, fundamental concerns such as declining profits, high P/E, and premium to intrinsic value warrant caution for long-term investors.
---
**Summary:**
Trident Ltd. is showing short-term bullish momentum with positive technical indicators and analyst sentiment. However, investors should be cautious due to weak long-term performance, high valuation, and recent declines in revenue and profit[1][2][3][4][5].
إخلاء المسؤولية
لا يُقصد بالمعلومات والمنشورات أن تكون، أو تشكل، أي نصيحة مالية أو استثمارية أو تجارية أو أنواع أخرى من النصائح أو التوصيات المقدمة أو المعتمدة من TradingView. اقرأ المزيد في شروط الاستخدام.
إخلاء المسؤولية
لا يُقصد بالمعلومات والمنشورات أن تكون، أو تشكل، أي نصيحة مالية أو استثمارية أو تجارية أو أنواع أخرى من النصائح أو التوصيات المقدمة أو المعتمدة من TradingView. اقرأ المزيد في شروط الاستخدام.