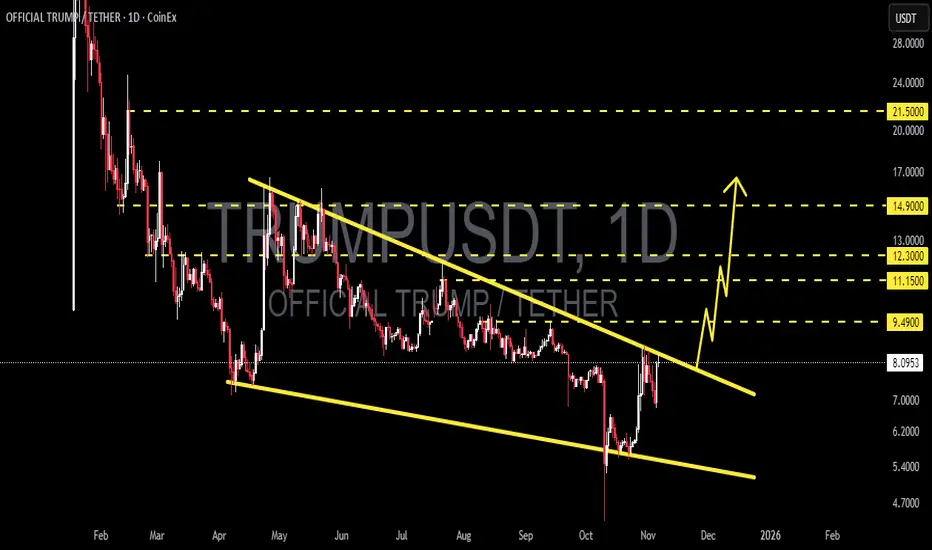
After a prolonged downtrend since mid-year, TRUMP/USDT is now showing one of the most exciting technical formations: a Descending Wedge, gradually tightening — a classic pattern that often precedes a major bullish reversal.
The price is currently hovering around $8.1, sitting just below the descending wedge resistance that has capped every rally for months. This structure suggests that selling pressure is weakening, while a potential breakout could be on the horizon if the market confirms a close above this trendline.
---
📈 Bullish Scenario — Breakout and Trend Reversal
A confirmed daily close above the wedge resistance could trigger a strong momentum shift, potentially marking the start of a new uptrend.
Key upside targets to watch:
TP1: $9.49 (initial breakout confirmation)
TP2: $11.15
TP3: $12.30
Extended targets: $14.90 — $21.50 if bullish sentiment accelerates
Additional confirmation may come from increasing volume, a strong bullish candle, or a successful retest of the breakout zone.
---
📉 Bearish Scenario — Rejection and Retest of Lower Support
If the price faces rejection from the wedge resistance once again, a pullback toward the lower wedge support around $6.0–5.4 could follow.
A clean breakdown below that zone would open the path to $4.7, the next significant demand area.
As long as price remains inside the wedge, however, the potential for a bullish reversal remains valid.
---
📊 Pattern Interpretation
The Descending Wedge pattern typically signals bullish reversal potential.
Each test of the lower boundary has produced a stronger recovery.
The wedge range is tightening — often a precursor to a volatility expansion.
Market sentiment remains neutral-to-bullish, awaiting a confirmed breakout candle.
---
💡 Conclusion
TRUMP/USDT is now sitting at a make-or-break zone.
A decisive breakout above the descending wedge could spark a significant trend reversal, while another rejection might extend consolidation a bit longer before the real move begins.
With volatility compressing and structure tightening, this setup might just be the calm before the storm — and whichever direction breaks next could define the trend for the rest of the quarter.
---
#TRUMPUSDT #TRUMP #CryptoAnalysis #DescendingWedge #BreakoutSetup #TechnicalAnalysis #CryptoTrading #BullishPattern #AltcoinAnalysis #ChartSetup #CryptoMarket #ReversalPattern #PriceAction
✅ Get Free Signals! Join Our Telegram Channel Here: t.me/TheCryptoNuclear
✅ Twitter: twitter.com/crypto_nuclear
✅ Join Bybit : partner.bybit.com/b/nuclearvip
✅ Benefits : Lifetime Trading Fee Discount -50%
✅ Twitter: twitter.com/crypto_nuclear
✅ Join Bybit : partner.bybit.com/b/nuclearvip
✅ Benefits : Lifetime Trading Fee Discount -50%
إخلاء المسؤولية
لا يُقصد بالمعلومات والمنشورات أن تكون، أو تشكل، أي نصيحة مالية أو استثمارية أو تجارية أو أنواع أخرى من النصائح أو التوصيات المقدمة أو المعتمدة من TradingView. اقرأ المزيد في شروط الاستخدام.