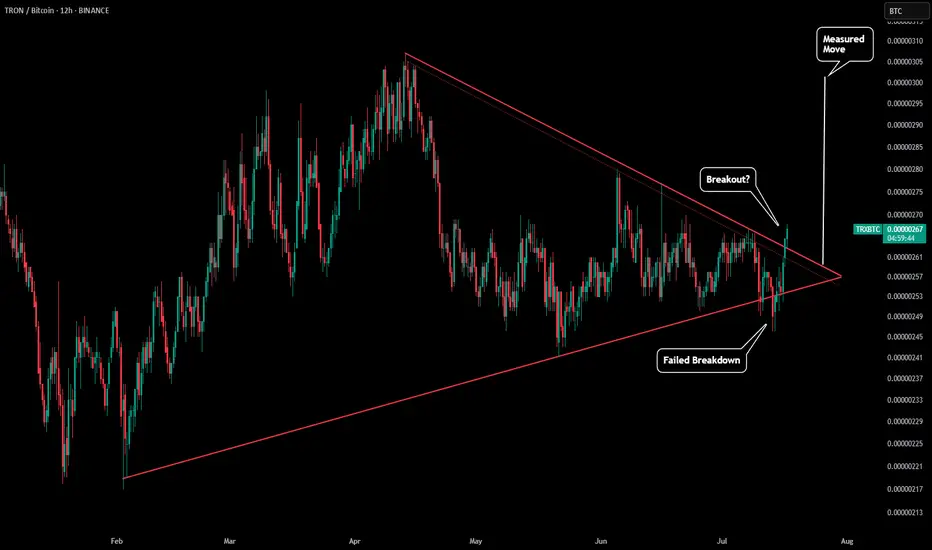
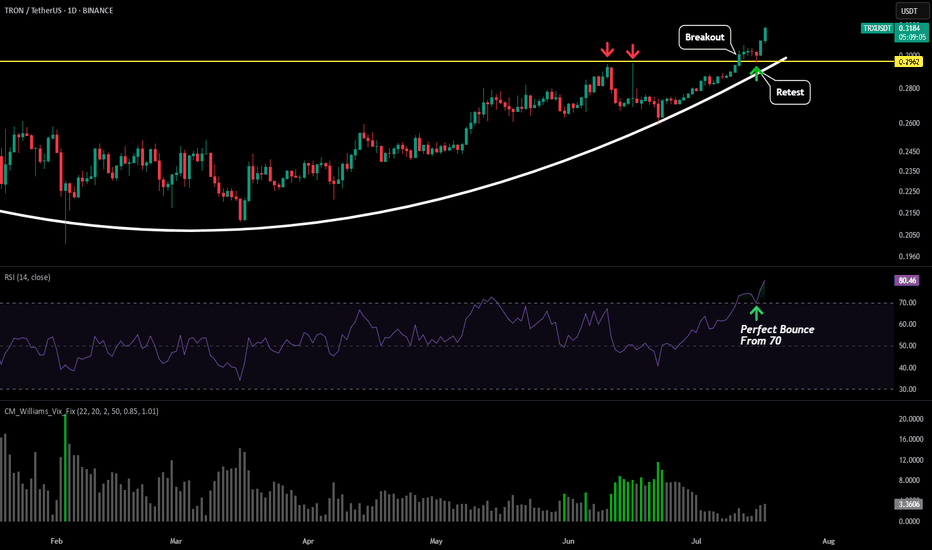
We have already seen the TRX/USD chart breakout (as seen in our previous post), but now the BTC pair is trying to breakout to.
On the daily chart we are trying to get above our downwards sloping red resistance line. It is possible we retest, but if this breakout continue that could push the BTC pair to above $0.000003 +. This is inline with our measured move (white line) and also where the symmetrical triangle started.
On the daily chart we are trying to get above our downwards sloping red resistance line. It is possible we retest, but if this breakout continue that could push the BTC pair to above $0.000003 +. This is inline with our measured move (white line) and also where the symmetrical triangle started.
إخلاء المسؤولية
لا يُقصد بالمعلومات والمنشورات أن تكون، أو تشكل، أي نصيحة مالية أو استثمارية أو تجارية أو أنواع أخرى من النصائح أو التوصيات المقدمة أو المعتمدة من TradingView. اقرأ المزيد في شروط الاستخدام.
إخلاء المسؤولية
لا يُقصد بالمعلومات والمنشورات أن تكون، أو تشكل، أي نصيحة مالية أو استثمارية أو تجارية أو أنواع أخرى من النصائح أو التوصيات المقدمة أو المعتمدة من TradingView. اقرأ المزيد في شروط الاستخدام.