TRXUSDT 1H Chart Analysis | Eyeing the Breakout for Momentum
🔍 Let’s break down TRX/USDT price action and identify setups that could unlock the next move, with a spotlight on RSI dynamics and key breakout levels.
⏳ 1-Hour Overview
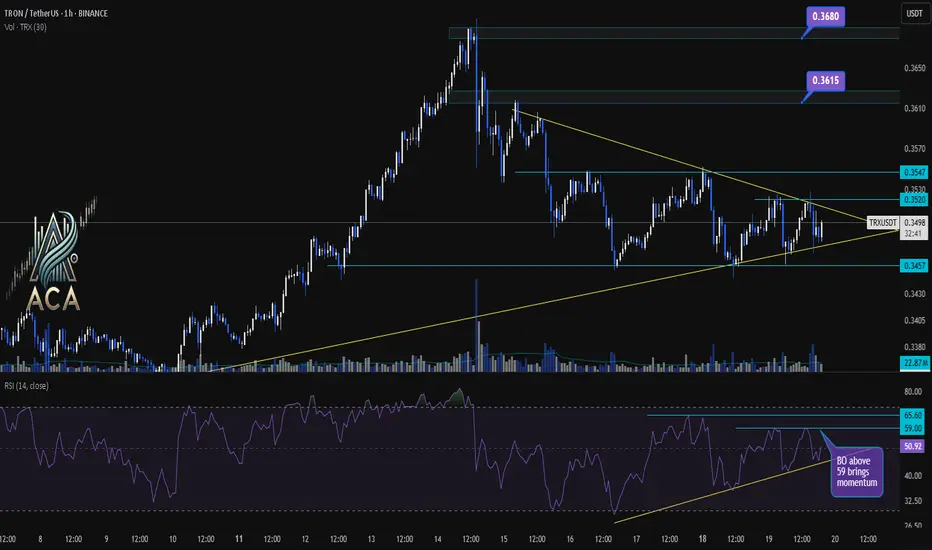
The chart is currently forming a tightening symmetrical triangle, signaling a squeeze ahead of an expected breakout. Price action is consolidating between the local support at $0.3457 and resistance near $0.3520–$0.3547.
📈 RSI Insights
- The RSI sits around 48, reflecting short-term indecision and neutral momentum.
- There’s a clear RSI trendline forming higher lows, indicating underlying strength building up.
- Watch closely: An RSI breakout above 59 is flagged as a momentum trigger, historically driving stronger moves.
📊 Key Highlights:
- Chart pattern: Tightening triangle points to an imminent volatility expansion.
- Price structure: Breakout (BO) above $0.3520 or, more convincingly, $0.3547 opens up higher targets.
- Bullish targets: $0.3615 and $0.3680—these mark the next resistance zones if upside momentum takes over.
- RSI dynamics: Trendline support on RSI signals hidden demand; BO above 59 on RSI can fuel upside moves.
🚨 Conclusion:
TRX is at a make-or-break juncture. A decisive breakout above $0.3520 or, even better, $0.3547 could unlock a rally to $0.3615 and $0.3680. Keep a close eye on the RSI—trendline holds and a thrust above 59 can serve as early confirmation of buyer strength.
🔍 Let’s break down TRX/USDT price action and identify setups that could unlock the next move, with a spotlight on RSI dynamics and key breakout levels.
⏳ 1-Hour Overview
The chart is currently forming a tightening symmetrical triangle, signaling a squeeze ahead of an expected breakout. Price action is consolidating between the local support at $0.3457 and resistance near $0.3520–$0.3547.
📈 RSI Insights
- The RSI sits around 48, reflecting short-term indecision and neutral momentum.
- There’s a clear RSI trendline forming higher lows, indicating underlying strength building up.
- Watch closely: An RSI breakout above 59 is flagged as a momentum trigger, historically driving stronger moves.
📊 Key Highlights:
- Chart pattern: Tightening triangle points to an imminent volatility expansion.
- Price structure: Breakout (BO) above $0.3520 or, more convincingly, $0.3547 opens up higher targets.
- Bullish targets: $0.3615 and $0.3680—these mark the next resistance zones if upside momentum takes over.
- RSI dynamics: Trendline support on RSI signals hidden demand; BO above 59 on RSI can fuel upside moves.
🚨 Conclusion:
TRX is at a make-or-break juncture. A decisive breakout above $0.3520 or, even better, $0.3547 could unlock a rally to $0.3615 and $0.3680. Keep a close eye on the RSI—trendline holds and a thrust above 59 can serve as early confirmation of buyer strength.
إخلاء المسؤولية
The information and publications are not meant to be, and do not constitute, financial, investment, trading, or other types of advice or recommendations supplied or endorsed by TradingView. Read more in the Terms of Use.
إخلاء المسؤولية
The information and publications are not meant to be, and do not constitute, financial, investment, trading, or other types of advice or recommendations supplied or endorsed by TradingView. Read more in the Terms of Use.