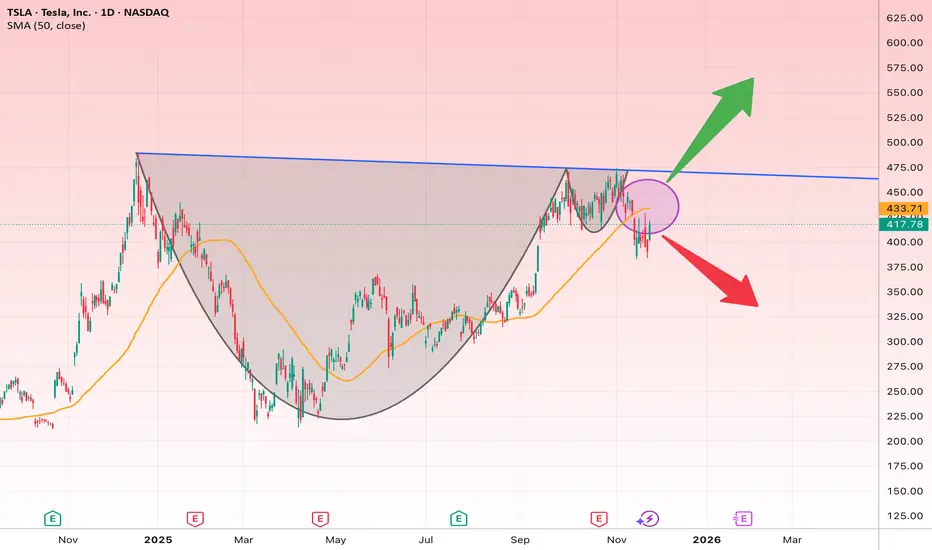
The chart shows a clear Cup & Handle pattern forming on the daily timeframe. Price touched the descending resistance (blue line) and failed to break out, placing TSLA at a critical decision point.
Key Points:
• Main Resistance: 450–465 zone (descending trendline + neckline of pattern)
• Major Support: 395–400 zone
• The 50-day MA is currently acting as near-term resistance.
Bullish Scenario (If price breaks above 465)
A breakout with a daily close above 465 would likely trigger:
• Target 1: $500
• Target 2: $545
• Target 3: $600
Bearish Scenario (If 395 breaks)
A breakdown below 395 may lead to:
• Bearish Target 1: $360
• Target 2: $325
Suggested Stop-Loss:
• $394 (for long positions)
إخلاء المسؤولية
The information and publications are not meant to be, and do not constitute, financial, investment, trading, or other types of advice or recommendations supplied or endorsed by TradingView. Read more in the Terms of Use.
إخلاء المسؤولية
The information and publications are not meant to be, and do not constitute, financial, investment, trading, or other types of advice or recommendations supplied or endorsed by TradingView. Read more in the Terms of Use.