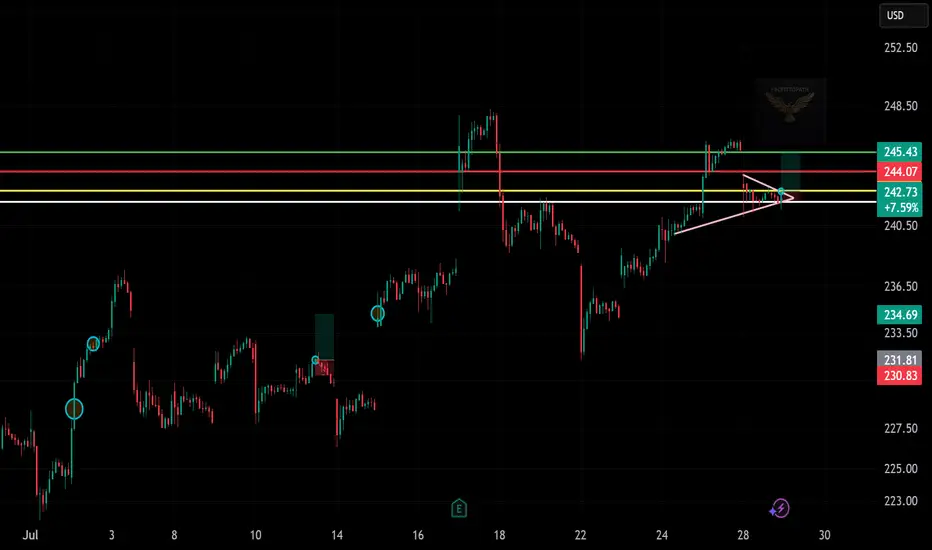
📈 (Taiwan Semiconductor)
🕰️ Timeframe: 30-minute chart
🔍 Pattern: Ascending triangle breakout
📉 Previous Trend: Recovery after drop
🔁 Setup: Bullish continuation with breakout confirmation
🧩 Technical Breakdown:
Support Zone:
~$242.50 (yellow horizontal support)
Uptrend line holding as dynamic support (pink diagonal)
Entry Zone:
Around $242.75, just above triangle breakout and support retest
Resistance / Target Levels:
TP1: $244.07 (red zone — minor supply)
TP2: $245.43 (green zone — prior high, resistance zone)
Stop Loss:
Below $241.80 or just under triangle trendline (~$241.25)
Risk-Reward Estimate:
Approximately 1:1.5 to 1:2 based on $1.5 risk and $3 reward potential
⚠️ What to Watch:
Volume confirmation during breakout or retest
Holding above yellow support zone and triangle trendline
Potential fake-out risk near $244 zone if volume fades
✅ Summary:
TSM is setting up a bullish continuation after reclaiming key levels and forming a tight ascending triangle. A clean breakout above $243 may trigger a move toward $245+ if buyers step in.
إخلاء المسؤولية
لا يُقصد بالمعلومات والمنشورات أن تكون، أو تشكل، أي نصيحة مالية أو استثمارية أو تجارية أو أنواع أخرى من النصائح أو التوصيات المقدمة أو المعتمدة من TradingView. اقرأ المزيد في شروط الاستخدام.
إخلاء المسؤولية
لا يُقصد بالمعلومات والمنشورات أن تكون، أو تشكل، أي نصيحة مالية أو استثمارية أو تجارية أو أنواع أخرى من النصائح أو التوصيات المقدمة أو المعتمدة من TradingView. اقرأ المزيد في شروط الاستخدام.