Hello, fellow traders!
Follow us to get the latest information quickly.
Have a great day!
-------------------------------------
How can you profit from trading with charts that show the above movements?
To trade, you need a basic trading strategy.
This basic trading strategy varies from person to person, so it's important to create a basic trading strategy that suits you.
The basic trading strategy I'm suggesting is to buy in the DOM(-60) ~ HA-Low range and sell in the HA-High ~ DOM(60) range.
However, if the HA-High ~ DOM(60) range rises, a step-up trend is likely, while if the DOM(-60) ~ HA-Low range falls, a step-down trend is likely.
Therefore, you should trade using a segmented trading method.
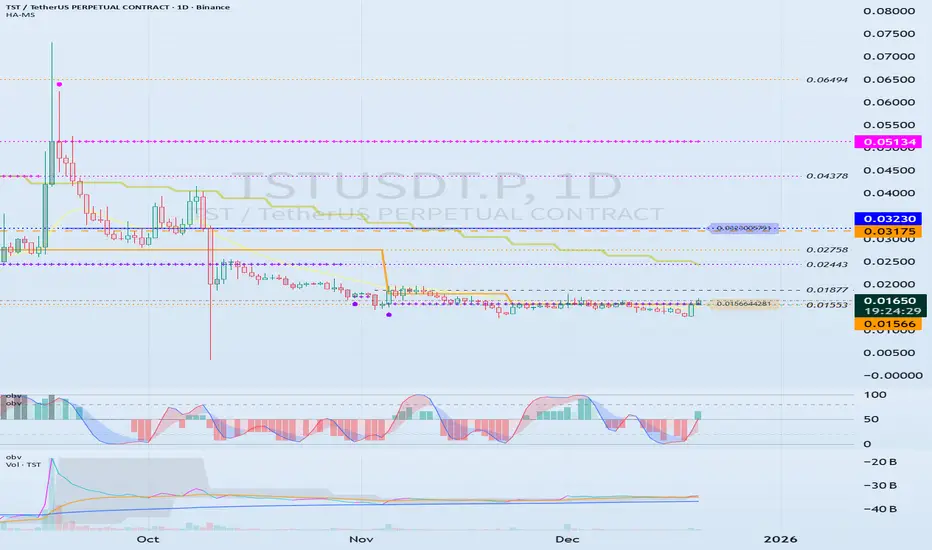
Looking at the chart, you can see that a step-down trend is occurring, and the HA-High indicator has been created for the first time.
Therefore, if the current HA-Low indicator level of 0.01566 is supported and the price rises, the wave will end around 0.03230.
If you zoom in on the chart, you can see that the M-Signal indicator on the 1D chart has risen above the HA-Low indicator and has broken above it.
Therefore, we can see that short-term trading is possible.
The following evidence supports this:
1. The TC indicator has risen above the 0 level.
2. The StochRSI indicator is showing an upward trend.
3. The OBV indicator is showing signs of rising above the High Line.
Therefore, we can initiate a trade around the HA-Low indicator level of 0.01566, depending on whether there is support.
However, since the price is in a stepwise downtrend, if it falls below 0.01566, we should cut our losses or sell in installments to secure funds for future purchases.
A full-scale uptrend is likely to begin when the M-Signal indicator on the 1W chart rises above it.
-
Unlike the TST chart, the CHZ chart has the M-Signal indicator from the 1M chart.
Therefore, to sustain a long-term uptrend, the price must rise above the M-Signal indicator on the 1M chart.
Currently, the price is in a stepwise downtrend, but it has risen above the M-Signal indicator on the 1W chart.
Therefore, if the price remains above the M-Signal indicator on the 1W chart, an uptrend is expected.
As mentioned earlier, the basic trading strategy considers the HA-High ~ DOM (60) range as a sell zone.
Therefore, we should respond based on the presence of support around the 0.04363-0.04631 range.
If the HA-High ~ DOM (60) range supports the price and rises, a stepwise uptrend is likely.
At this point, the key is whether the price can sustain itself by breaking above the M-Siganl indicator on the 1M chart.
-
To continue the uptrend by breaking above a key point or range, the following conditions must be met:
1. The TC indicator must be trending upward. If possible, it should remain above the zero level.
2. The StochRSI indicator must be trending upward. If possible, it should not enter the overbought zone.
3. The OBV indicator must be trending upward. If possible, it should remain above the High Line.
Based on the above conditions, the current price movement appears highly likely to continue upward.
However, if the price breaks above the next important level, the 0.04363-0.04631 range, we must reassess whether the above conditions are met.
------------------------------------------------------------
To trade, we strive to gather as much information as possible.
This information includes issues beyond the chart itself.
However, if you identify issues outside of the chart before the chart analysis is complete, you may end up analyzing the chart subjectively. Therefore, it's best to explore other issues after the chart analysis is complete.
The most important thing when looking at a chart is the flow of funds.
However, it can be difficult for individual investors to understand this flow.
Analyzing trading volume can also be difficult, so to simplify this process, we created the TC indicator, which utilizes the OBV and PVT indicators.
Furthermore, the DOM indicator, which comprehensively evaluates the DMI, OBV, and MONENTUM indicators, also includes trading volume and displays support and resistance points.
Additionally, you can activate the StochRSI 20, 50, and 80 indicators, as well as the OBV High and Low indicators.
You can utilize these indicators to further refine your trading strategy.
However, you should first check the movement and alignment of the M-Signal indicator on the 1M, 1W, and 1D charts.
Next, you should check the location of the DOM(-60) ~ HA-Low or HA-High ~ DOM(-60) range and determine whether there is support near those areas.
Using other people's indicators or chart analysis requires significant time and observation.
Otherwise, you are more likely to misinterpret the data and fail to trade.
To utilize my charts, it's recommended to activate the indicators as follows:
1. Activate only the M-Signal and HA-Low/HA-High indicators on the 1M, 1W, and 1D charts to check and observe the basic chart movements.
You can trade with these indicators alone.
However, if volatility occurs, the high and low points are not clearly defined, which can delay response times.
2. To prevent this, activate the DOM(60) and DOM(-60) indicators. The DOM(60) indicator represents a high, while the DOM(-60) indicator represents a low.
Therefore, you can buy around the DOM(-60) ~ HA-Low range depending on whether there's support, and sell around the HA-High ~ DOM(60) range depending on whether there's support.
3. If you're comfortable interpreting steps 1 and 2, you can use the movements of the auxiliary indicators TC, StochRSI, and OBV.
Steps 1 and 2 can be thought of as indicating support and resistance points. When determining support near these points, refer to the movements of the auxiliary indicators TC, StochRSI, and OBV to help you determine whether there's support.
Becoming proficient at interpreting steps 1 through 3 will greatly aid you in identifying trading opportunities.
-
Thank you for reading to the end.
I wish you successful trading.
--------------------------------------------------
ملاحظة
#ZECUSDTTo rise, the StochRSI indicator must rise above 80 and maintain price stability.
Therefore, the StochRSI 80 level is a significant short-term indicator.
To break above this critical level and continue the uptrend, the TC, StochRSI, and OBV indicators must show upward trends.
If possible,
1. The TC indicator should remain above 0.
2. The StochRSI indicator should not have entered the overbought zone.
3. The OBV indicator should remain above the High Line.
If the price declines, check for support near the M-Signal indicator on the 1D chart.
Therefore, check for support near 422.80.
※ Follow X to check out the posts.
※ X를 팔로우하고 게시물을 확인하세요.
◆ t.me/readCryptoChannel
[HA-MS Indicator]
bit.ly/3YxHgvN
[OBV Indicator]
bit.ly/4dcyny3
※ X를 팔로우하고 게시물을 확인하세요.
◆ t.me/readCryptoChannel
[HA-MS Indicator]
bit.ly/3YxHgvN
[OBV Indicator]
bit.ly/4dcyny3
إخلاء المسؤولية
لا يُقصد بالمعلومات والمنشورات أن تكون، أو تشكل، أي نصيحة مالية أو استثمارية أو تجارية أو أنواع أخرى من النصائح أو التوصيات المقدمة أو المعتمدة من TradingView. اقرأ المزيد في شروط الاستخدام.