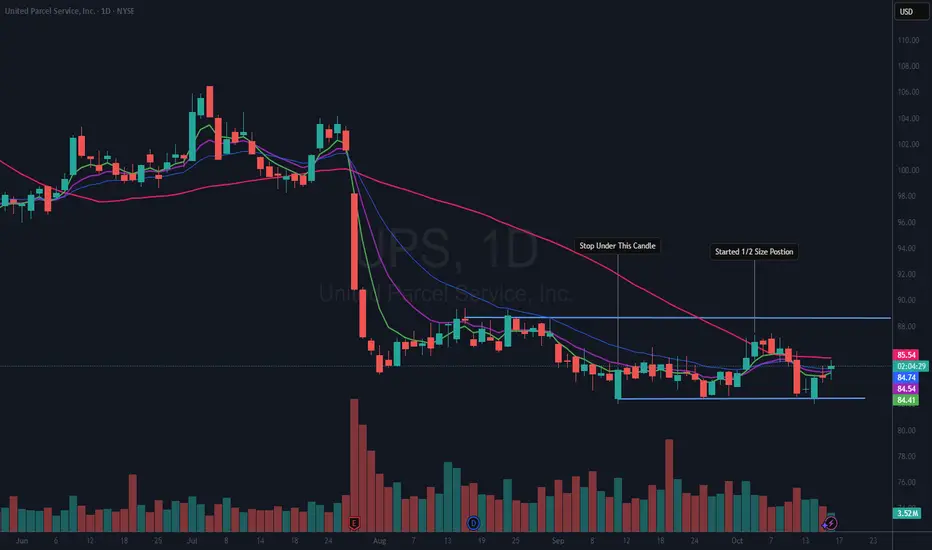
Overview of UPS Price Movements
UPS reached an all-time high (ATH) of $198.25, with a 52-week high at $145.01 and a 52-week low at $82.00. The stock experienced a significant decline, falling more than 58% from its ATH and over 43% from its 52-week high. After monitoring the company’s steady downward trend for several years, a sharp drop following the latest earnings report renewed interest in its performance.
Initial Entry and Position Management
Interest in a long position was sparked when the 50-day moving average (DMA) caught up with the stock’s price. On October 3rd, a half-sized position was initiated after observing three consecutive up days, which suggested a potential bottom. This move was confirmed as the price closed above both the 21-day exponential moving average (EMA) and the 50 DMA. The stop-loss was set just below the recent lowest low of $82.00.
Current Trade Status and Analysis
The trade remains active, although currently underwater, as the original stop-loss has not been triggered. The double bottom theory now guides the position, since the low on October 14th also touched the $82.00 level and rebounded. Presently, the price is slightly below my buy point but continues to test the 50 DMA, which has now leveled out.
Future Trading Strategy
The plan is to hold the position until either a breakout above the blue resistance area occurs—at which point the position would be increased in anticipation of a stage 2 breakout—or until the price falls below $82.00, activating the stop-loss. If not currently in this trade, the preferred approach would be to wait for the stock to close above the 50 DMA again or for a breakout above the upper horizontal resistance area before entering.
Disclaimer
Readers are encouraged to conduct their own analysis and adhere to personal trading rules. Investing always involves risk, so it is crucial to make informed decisions with your own capital.
Ideas I publish are my own. They are not meant to be investment / trading advice. You are encouraged to do your own due diligence.
I am under no obligation to post any action or update to any idea.
Follow me on "X" where I post more content.
I am under no obligation to post any action or update to any idea.
Follow me on "X" where I post more content.
إخلاء المسؤولية
لا يُقصد بالمعلومات والمنشورات أن تكون، أو تشكل، أي نصيحة مالية أو استثمارية أو تجارية أو أنواع أخرى من النصائح أو التوصيات المقدمة أو المعتمدة من TradingView. اقرأ المزيد في شروط الاستخدام.