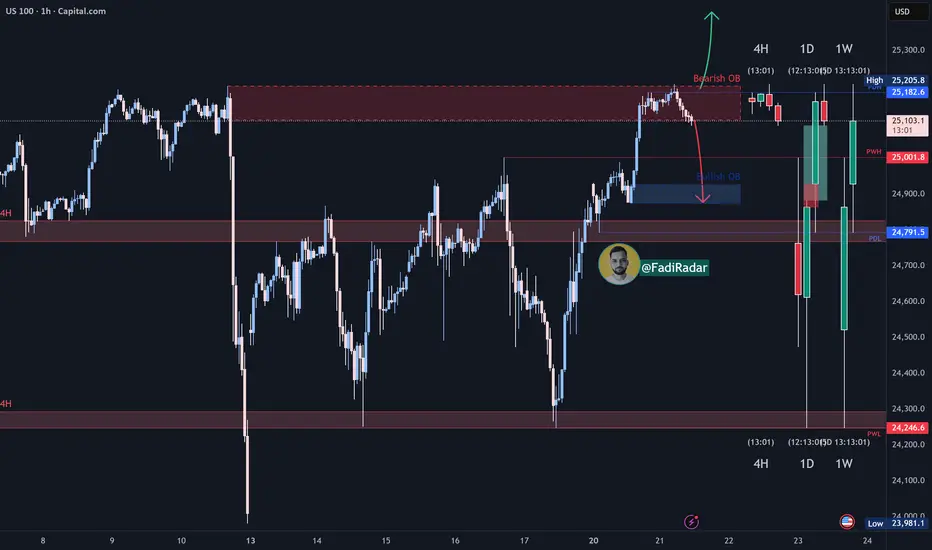
The NASDAQ index recently tested its all-time high and is now showing signs of a potential corrective pullback after a strong bullish run.
📉 Expected scenario:
The price may retrace toward the 24,900 demand zone, which serves as an important support area.
If the index bounces from this level, it could resume its upward movement to form a new high.
However, if the price breaks below 24,900 and holds, a deeper move toward 24,600 is likely.
📈 Best buy zone: On a confirmed rebound from 24,900
📍 Best sell zone: On a confirmed rebound from 25,100, or Below 24,900 after confirmation
إخلاء المسؤولية
لا يُقصد بالمعلومات والمنشورات أن تكون، أو تشكل، أي نصيحة مالية أو استثمارية أو تجارية أو أنواع أخرى من النصائح أو التوصيات المقدمة أو المعتمدة من TradingView. اقرأ المزيد في شروط الاستخدام.
إخلاء المسؤولية
لا يُقصد بالمعلومات والمنشورات أن تكون، أو تشكل، أي نصيحة مالية أو استثمارية أو تجارية أو أنواع أخرى من النصائح أو التوصيات المقدمة أو المعتمدة من TradingView. اقرأ المزيد في شروط الاستخدام.