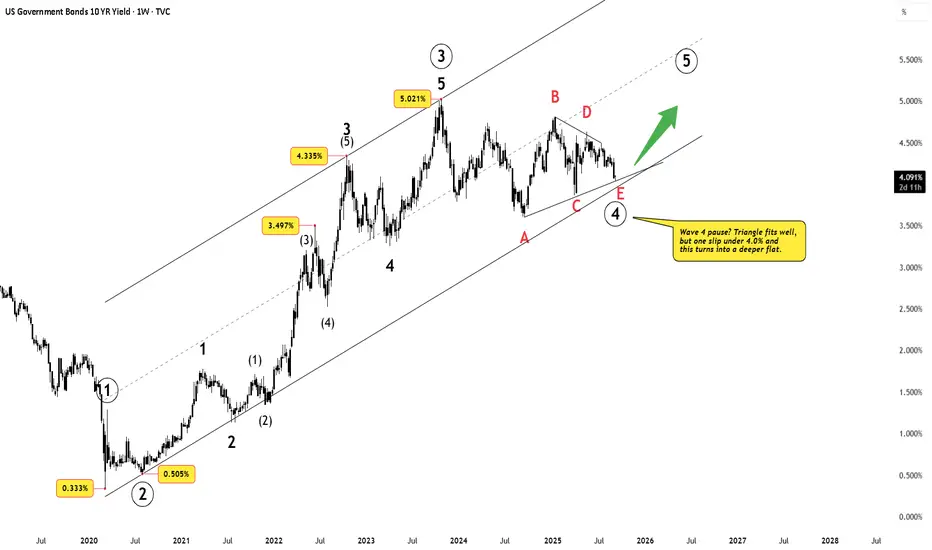
US 10Y Yield – Wave 4 Pause Before the Final Surge

Disclaimer: This analysis is for educational purposes only and does not constitute investment advice. Please do your own research (DYOR) before making any trading decisions.
The Setup
The US 10-year yield has been consolidating after topping near 5.021%. Price action since then has formed a contracting structure that looks very much like a Wave 4 triangle.
At present, yields hover near 4.0% — a crucial pivot.
Either way, the Elliott script points to one more advance: Wave 5 up.
What Wave 5 Could Mean
If the US 10-year yield really enters Wave ⑤ up, buckle up:
In short: Wave ⑤ = a macro “stress test.”
Why India Should Care
A breakout in US yields rarely stays a US-only story. For India, it means:
Final Thoughts
The triangle scenario points to an imminent breakout above 5.0%. A deeper flat only delays it. For traders and investors, this is the chart to watch — because Wave 5 in US yields isn’t just a bond market story, it’s a global macro shockwave.
The Setup
The US 10-year yield has been consolidating after topping near 5.021%. Price action since then has formed a contracting structure that looks very much like a Wave 4 triangle.
At present, yields hover near 4.0% — a crucial pivot.
- Triangle view: Wave 4 is complete, setting the stage for Wave 5 higher.
- Flat view: If yields break below 4.0%, Wave 4 may stretch deeper into a flat correction, potentially testing 3.6–3.7%.
Either way, the Elliott script points to one more advance: Wave 5 up.
What Wave 5 Could Mean
If the US 10-year yield really enters Wave ⑤ up, buckle up:
- Bond prices tank → inverse relation, so Treasuries bleed.
- Equities feel the heat → higher yields = expensive valuations, especially for growth stocks.
- Dollar flexes → global FX could see USD strength.
- Borrowing costs bite → mortgages, corporate loans, government debt servicing all tighten.
In short: Wave ⑤ = a macro “stress test.”
Why India Should Care
A breakout in US yields rarely stays a US-only story. For India, it means:
- FII outflows as global funds chase safer US returns
- INR under pressure, increasing imported inflation risks
- Indian bond yields rising, even without RBI action
- Equity market stress, especially in IT and rate-sensitive sectors
Final Thoughts
The triangle scenario points to an imminent breakout above 5.0%. A deeper flat only delays it. For traders and investors, this is the chart to watch — because Wave 5 in US yields isn’t just a bond market story, it’s a global macro shockwave.
WaveXplorer | Elliott Wave insights
📊 X profile: @veerappa89
📊 X profile: @veerappa89
إخلاء المسؤولية
لا يُقصد بالمعلومات والمنشورات أن تكون، أو تشكل، أي نصيحة مالية أو استثمارية أو تجارية أو أنواع أخرى من النصائح أو التوصيات المقدمة أو المعتمدة من TradingView. اقرأ المزيد في شروط الاستخدام.
WaveXplorer | Elliott Wave insights
📊 X profile: @veerappa89
📊 X profile: @veerappa89
إخلاء المسؤولية
لا يُقصد بالمعلومات والمنشورات أن تكون، أو تشكل، أي نصيحة مالية أو استثمارية أو تجارية أو أنواع أخرى من النصائح أو التوصيات المقدمة أو المعتمدة من TradingView. اقرأ المزيد في شروط الاستخدام.