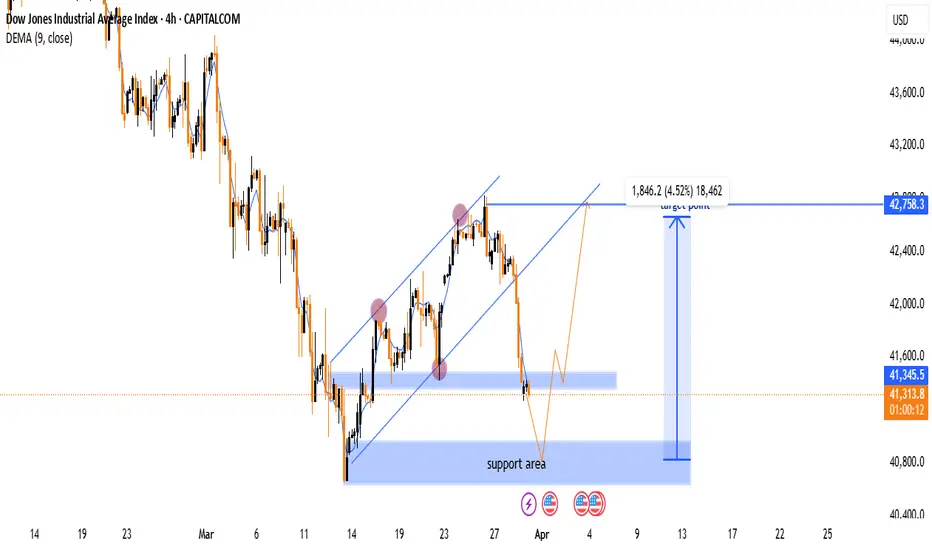
📉 Downtrend: The price was falling sharply before forming an upward channel.
📊 Channel Break: The price broke below the ascending channel 🚨.
🟦 Support Zone: The blue area marks a strong support region 📌.
🔵 Bounce Expected? If the price holds, a rebound could happen 📈.
🎯 Target: The projected upside target is 42,758.3 🚀.
⚠️ Risk: If the support fails, the price may drop further ⛔.
🔴 Watch for: A confirmed reversal near support or further breakdown!
join my tellegram channel
t.me/+yhY0QtYtM0g0NWM0
join my refferal broker
one.exnesstrack.org/a/g565sj1uo7?source=app
t.me/+yhY0QtYtM0g0NWM0
join my refferal broker
one.exnesstrack.org/a/g565sj1uo7?source=app
إخلاء المسؤولية
لا يُقصد بالمعلومات والمنشورات أن تكون، أو تشكل، أي نصيحة مالية أو استثمارية أو تجارية أو أنواع أخرى من النصائح أو التوصيات المقدمة أو المعتمدة من TradingView. اقرأ المزيد في شروط الاستخدام.