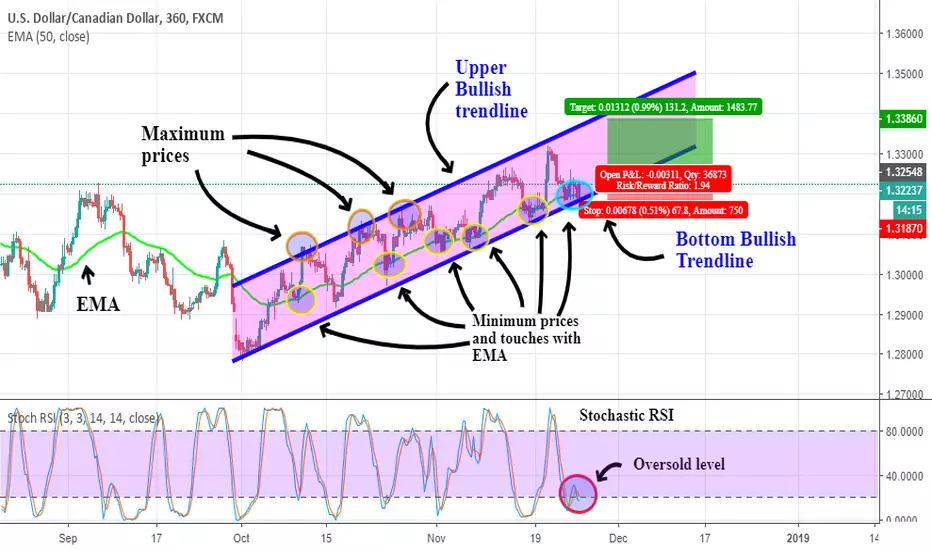
In the chart of the USDCAD we can see and ascending channel forming in a six hours time frame. As the actual price is touching the bottom bullish trend line, we can settle a long position near 1.3254, with a Stop Loss in 1.3187 and a Take profit near the upper bullish trend line at 1.3386 approximately. Also, the Stochastic RSI is in a oversold level, which indicates a possible rise in the price. Finally, there are 5 points previous to the current one where the price touched the EMA and bounced. Therefore, as the price is again touching the EMA, it is expected to bounce.
إخلاء المسؤولية
لا يُقصد بالمعلومات والمنشورات أن تكون، أو تشكل، أي نصيحة مالية أو استثمارية أو تجارية أو أنواع أخرى من النصائح أو التوصيات المقدمة أو المعتمدة من TradingView. اقرأ المزيد في شروط الاستخدام.
إخلاء المسؤولية
لا يُقصد بالمعلومات والمنشورات أن تكون، أو تشكل، أي نصيحة مالية أو استثمارية أو تجارية أو أنواع أخرى من النصائح أو التوصيات المقدمة أو المعتمدة من TradingView. اقرأ المزيد في شروط الاستخدام.