The MACD indicator shows that the DIFF line has formed a golden cross with the DEA line, and the red histogram has continuously expanded, indicating that the upward trend has been established. At the same time, the RSI indicator has rebounded from the oversold area to the level of 59.777, suggesting that there is still room for the exchange rate to rise. It is worth noting that the CCI indicator has broken through the 200 level, implying that there is a possibility of a short-term technical correction.
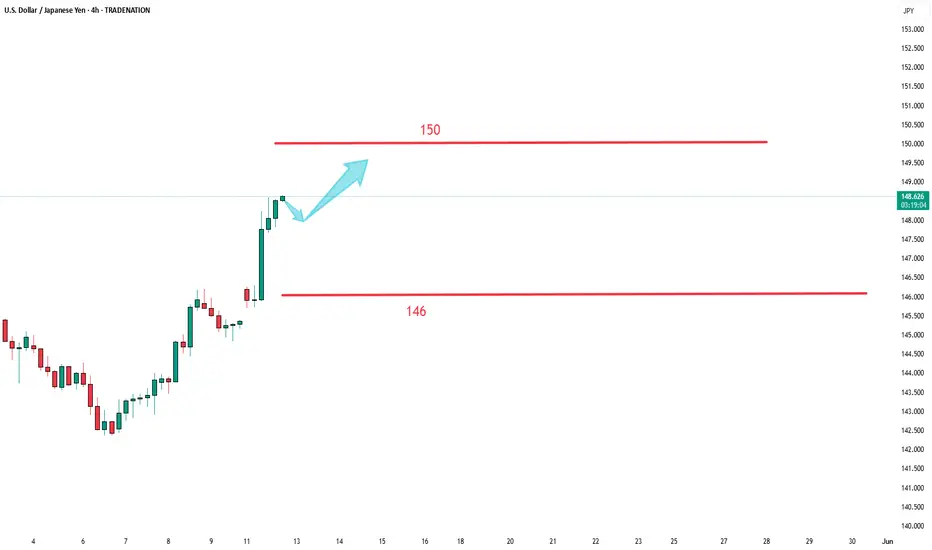
In terms of volatility analysis, the Bollinger Bands have widened. The upper band is at 147.845 and the lower band is at 139.942, indicating that market volatility is increasing. Currently, the exchange rate is moving within an upward-sloping triangular consolidation pattern. 150 constitutes an important resistance level in the near term, while 146 forms a key support level. In the short term, if the exchange rate can effectively hold above the 148 mark, it will further confirm the continuation of the upward trend.
you are currently struggling with losses, or are unsure which of the numerous trading strategies to follow, at this moment, you can choose to observe the operations within our channel.
إخلاء المسؤولية
لا يُقصد بالمعلومات والمنشورات أن تكون، أو تشكل، أي نصيحة مالية أو استثمارية أو تجارية أو أنواع أخرى من النصائح أو التوصيات المقدمة أو المعتمدة من TradingView. اقرأ المزيد في شروط الاستخدام.
إخلاء المسؤولية
لا يُقصد بالمعلومات والمنشورات أن تكون، أو تشكل، أي نصيحة مالية أو استثمارية أو تجارية أو أنواع أخرى من النصائح أو التوصيات المقدمة أو المعتمدة من TradingView. اقرأ المزيد في شروط الاستخدام.