analyzing USD/JPY on the 3H chart.
Looking at my chart:
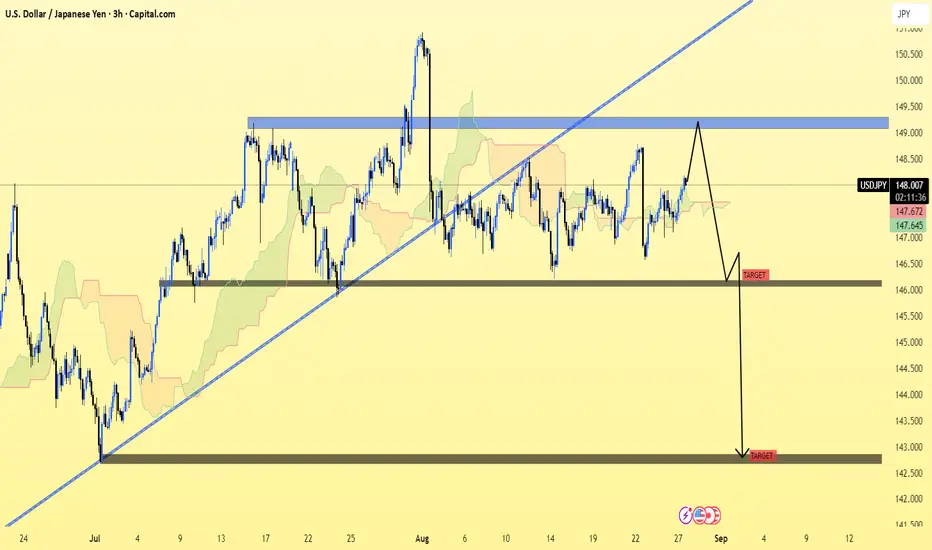
Price is trading around 148.05.
There’s a blue resistance zone near 149.00–149.50 (supply area).
You have drawn two downside targets after potential rejection.
📉 Key Bearish Targets (from your chart)
1. First Target Zone: Around 146.50
→ This is the first strong support area marked.
2. Second / Final Target Zone: Around 142.00–142.20
→ If bearish continuation plays out, this is the larger downside target.
⚠ Trade Notes
A rejection from 149.00 resistance could trigger a fall toward 146.50.
A break below 146.50 support would strengthen bearish momentum, opening the way to 142.00.
On the other hand, if price breaks and holds above 149.50, this bearish scenario is invalidated.
👉 In summary: Target 1 = 146.50, Target 2 = 142.00.
Looking at my chart:
Price is trading around 148.05.
There’s a blue resistance zone near 149.00–149.50 (supply area).
You have drawn two downside targets after potential rejection.
📉 Key Bearish Targets (from your chart)
1. First Target Zone: Around 146.50
→ This is the first strong support area marked.
2. Second / Final Target Zone: Around 142.00–142.20
→ If bearish continuation plays out, this is the larger downside target.
⚠ Trade Notes
A rejection from 149.00 resistance could trigger a fall toward 146.50.
A break below 146.50 support would strengthen bearish momentum, opening the way to 142.00.
On the other hand, if price breaks and holds above 149.50, this bearish scenario is invalidated.
👉 In summary: Target 1 = 146.50, Target 2 = 142.00.
تم فتح الصفقة
trade activeمنشورات ذات صلة
إخلاء المسؤولية
لا يُقصد بالمعلومات والمنشورات أن تكون، أو تشكل، أي نصيحة مالية أو استثمارية أو تجارية أو أنواع أخرى من النصائح أو التوصيات المقدمة أو المعتمدة من TradingView. اقرأ المزيد في شروط الاستخدام.
منشورات ذات صلة
إخلاء المسؤولية
لا يُقصد بالمعلومات والمنشورات أن تكون، أو تشكل، أي نصيحة مالية أو استثمارية أو تجارية أو أنواع أخرى من النصائح أو التوصيات المقدمة أو المعتمدة من TradingView. اقرأ المزيد في شروط الاستخدام.