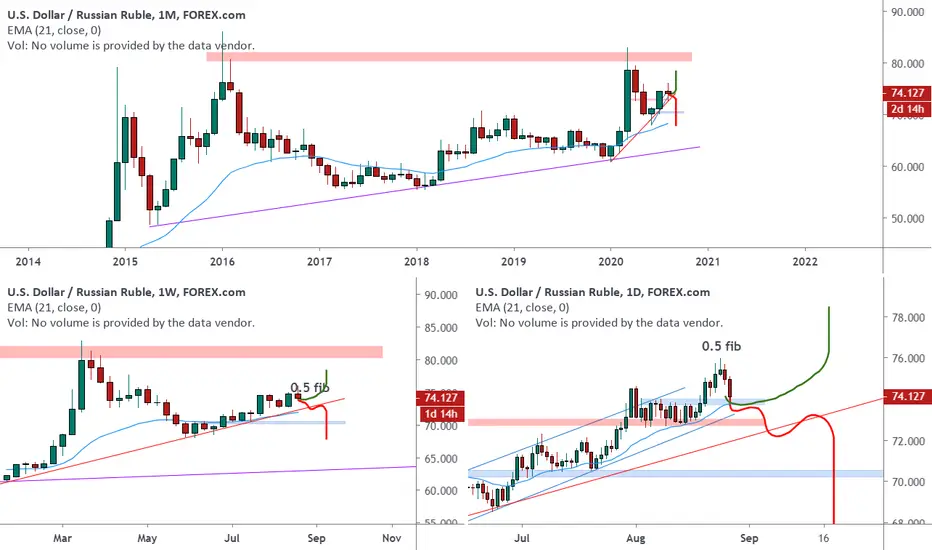
USDRUB on the monthly chart is in an uptrend and market after testing the highs at the 82 area has moved down till 68 zone beofre startin g a new move up.
Now on the weekly chart (low left) we can see that price retraced back till exactly the 0.5 fib level of the down move higher.
On the daily chart price move down till the daily support and during next weeks we can expect 2 different scenarios.
If the market will break below the weekly support we will check for a short order, on the other hand if the market will give us a sign of inversion we can monitor the pair for a new test of tthe highs.
–––––
Follow the Shrimp 🦐
Here is the Plancton0618 technical analysis, please comment below if you have any question.
The ENTRY in the market will be taken only if the condition of Plancton0618 strategy will trigger.
ملاحظة
ملاحظة
إخلاء المسؤولية
لا يُقصد بالمعلومات والمنشورات أن تكون، أو تشكل، أي نصيحة مالية أو استثمارية أو تجارية أو أنواع أخرى من النصائح أو التوصيات المقدمة أو المعتمدة من TradingView. اقرأ المزيد في شروط الاستخدام.
إخلاء المسؤولية
لا يُقصد بالمعلومات والمنشورات أن تكون، أو تشكل، أي نصيحة مالية أو استثمارية أو تجارية أو أنواع أخرى من النصائح أو التوصيات المقدمة أو المعتمدة من TradingView. اقرأ المزيد في شروط الاستخدام.