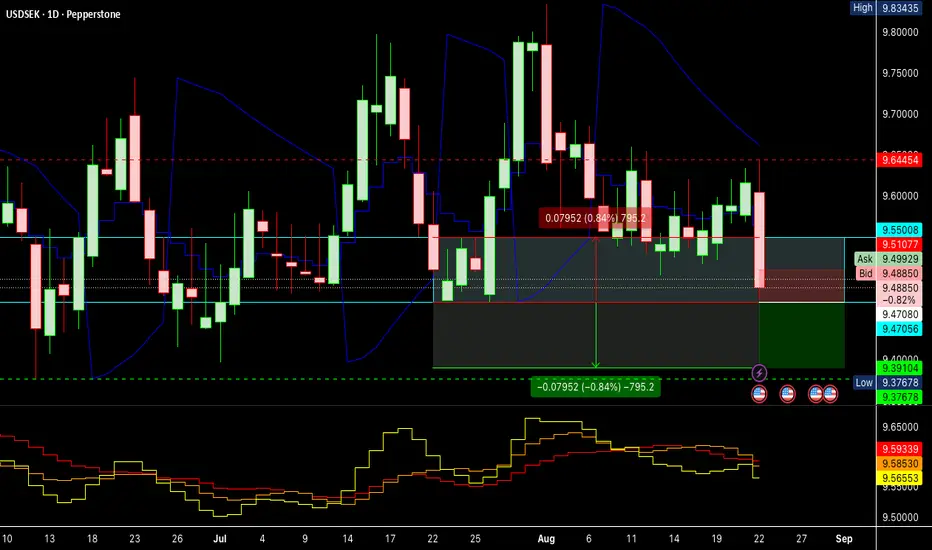
In the analysis of the USD/SEK pair on lower time-frames, there is a potential for a selling movement.
Although the pair has experienced several periods of consolidation and an extended bullish trend, there is a possibility of a downside correction, associated with the context of U.S. monetary policy and the potential for interest rate cuts.
On higher time-frames (from daily to monthly), bearish candles show selling pressure. Additionally, the following technical indicators:
* 8-period Exponential Moving Average,
* 16- and 24-period Simple Moving Averages,
* Parabolic SAR,
are aligned in the same direction, reinforcing the probability of a continued downward movement.
It is important to note that, while technical analysis provides relevant signals, it is essential to also monitor economic data, news, and other fundamental factors that may influence this pair. In this analysis, only the technical component was considered.
The short position tool shown on the chart is provided for visual support only and should not be interpreted as a definitive entry signal.
Disclaimer: This analysis solely reflects my personal view of the market and does not, under any circumstances, constitute an investment recommendation.
إخلاء المسؤولية
لا يُقصد بالمعلومات والمنشورات أن تكون، أو تشكل، أي نصيحة مالية أو استثمارية أو تجارية أو أنواع أخرى من النصائح أو التوصيات المقدمة أو المعتمدة من TradingView. اقرأ المزيد في شروط الاستخدام.
إخلاء المسؤولية
لا يُقصد بالمعلومات والمنشورات أن تكون، أو تشكل، أي نصيحة مالية أو استثمارية أو تجارية أو أنواع أخرى من النصائح أو التوصيات المقدمة أو المعتمدة من TradingView. اقرأ المزيد في شروط الاستخدام.