USDT Dominance Chart Update.
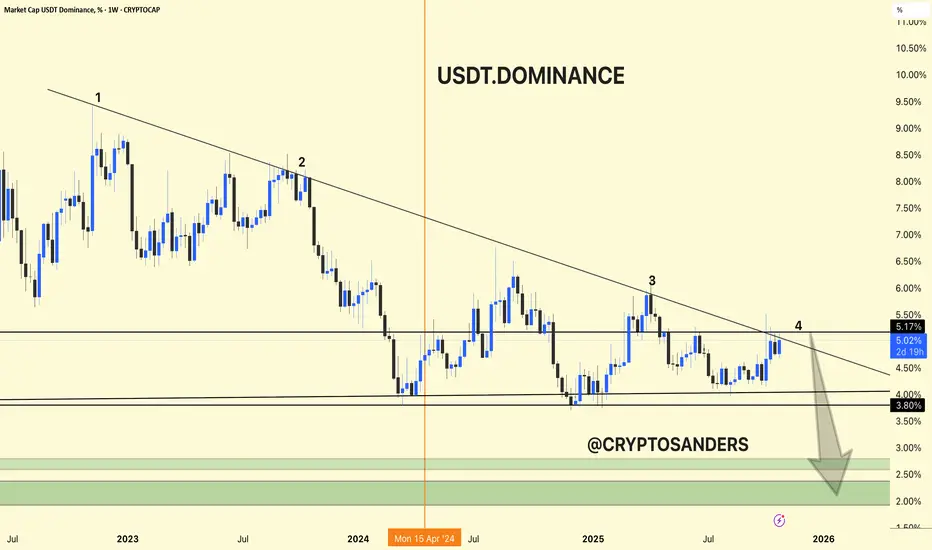
USDT dominance is again rejecting at the long-term trendline resistance (point 4), currently around 5.17%.
Structure suggests another potential move lower, with possible targets in the green zone (2.0%–3.0%) if the downtrend continues.
This scenario typically favors fresh capital rotation into Bitcoin and altcoins as traders de-risk from stablecoins.
Summary:
USDT dominance remains weak below the trendline. A sustained drop could spark further altcoin momentum and a broader crypto rally.
منشورات ذات صلة
إخلاء المسؤولية
لا يُقصد بالمعلومات والمنشورات أن تكون، أو تشكل، أي نصيحة مالية أو استثمارية أو تجارية أو أنواع أخرى من النصائح أو التوصيات المقدمة أو المعتمدة من TradingView. اقرأ المزيد في شروط الاستخدام.
منشورات ذات صلة
إخلاء المسؤولية
لا يُقصد بالمعلومات والمنشورات أن تكون، أو تشكل، أي نصيحة مالية أو استثمارية أو تجارية أو أنواع أخرى من النصائح أو التوصيات المقدمة أو المعتمدة من TradingView. اقرأ المزيد في شروط الاستخدام.