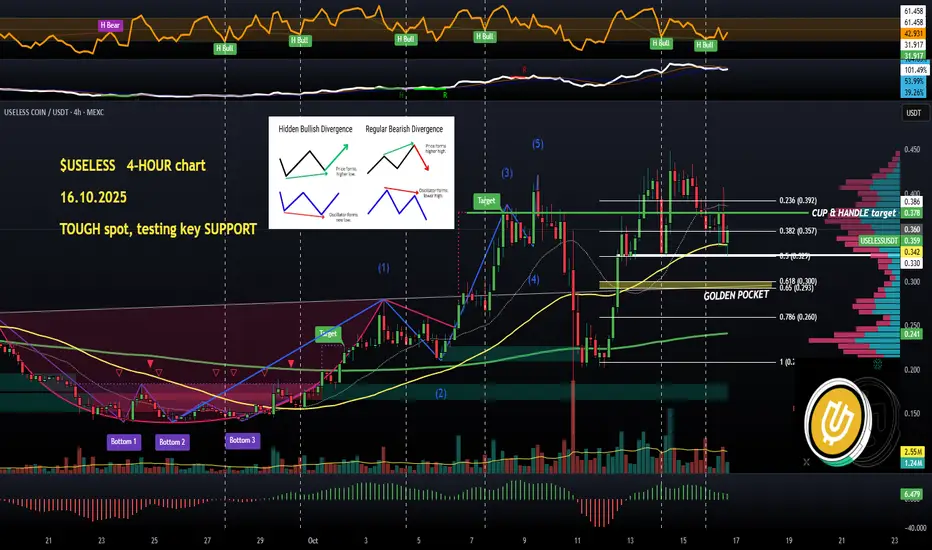
$USELESS 4-HOUR chart is actually a brilliant material for anyone who wants to see how powerful HIDDEN BULLISH RSI divergences tend to be.
I put vertical dotted lines to demonstrate that we have had 6 of these divergences in a row, and the first 5 'predicted' an explosive rally. And last night I spotted the 6th one.
Except, in all previous cases a hidden bullish divergence was followed by a volume spike, not this time. Red flag. Volume is confirmation, which in this case is a bad sign, pointing to a loss of momentum.
This rally could morph into a steep decline imo, if #useless closes below the 33c support (fib 0.5), which would be a bearish market STRUCTURE flip. Essentially, a proper LOWER LOW.
Positioning around a GOLDEN POCKET (29 - 30c) makes sense due to a confluence of the pocket with a former CUP & HANDLE neckline (which is a current PIVOT trendline - a support/resistance decider).
In a nutshell, definitely no longs unless from the GOLDEN POCKET or 0.786 fib ($26c).
Possible shorts below 33c, but I would need more technical signals to confirm in real time. 💙👽
إخلاء المسؤولية
لا يُقصد بالمعلومات والمنشورات أن تكون، أو تشكل، أي نصيحة مالية أو استثمارية أو تجارية أو أنواع أخرى من النصائح أو التوصيات المقدمة أو المعتمدة من TradingView. اقرأ المزيد في شروط الاستخدام.
إخلاء المسؤولية
لا يُقصد بالمعلومات والمنشورات أن تكون، أو تشكل، أي نصيحة مالية أو استثمارية أو تجارية أو أنواع أخرى من النصائح أو التوصيات المقدمة أو المعتمدة من TradingView. اقرأ المزيد في شروط الاستخدام.