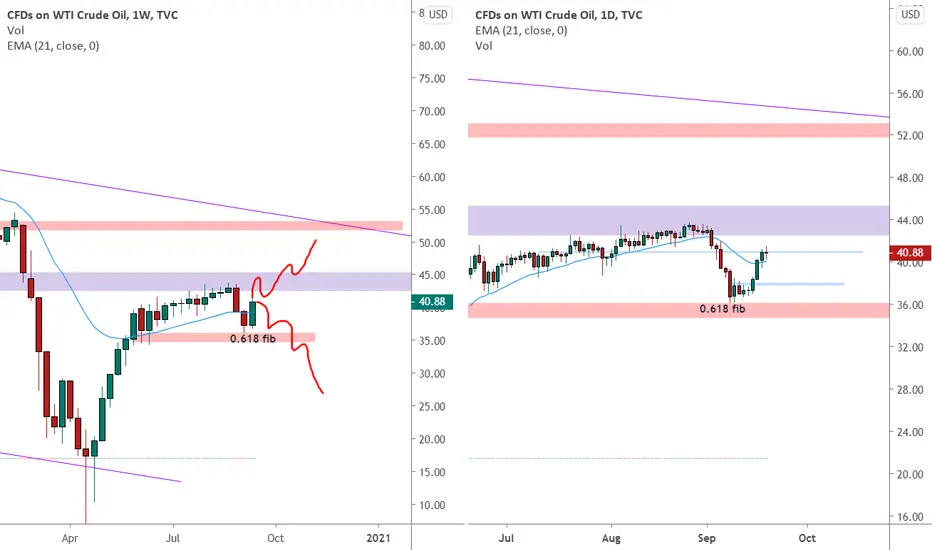
Oil on the Weekly chart hit the strong resistance near to a monthly level and start a retracement back.
The market after hit the lower weekly structure at the 0.618 fib level retracement and couldn’t manage to break below.
Price bounce over it and create a weekly double bottom higher close.
In the lower right chart (daily) we can see that price is now near to a minor daily resistance.
We will consider to open a position only at the break of the key level as shown on the chart.
–––––
Follow the Shrimp 🦐
Here is the Plancton0618 technical analysis , please comment below if you have any question.
The ENTRY in the market will be taken only if the condition of Plancton0618 strategy will trigger
إخلاء المسؤولية
لا يُقصد بالمعلومات والمنشورات أن تكون، أو تشكل، أي نصيحة مالية أو استثمارية أو تجارية أو أنواع أخرى من النصائح أو التوصيات المقدمة أو المعتمدة من TradingView. اقرأ المزيد في شروط الاستخدام.
إخلاء المسؤولية
لا يُقصد بالمعلومات والمنشورات أن تكون، أو تشكل، أي نصيحة مالية أو استثمارية أو تجارية أو أنواع أخرى من النصائح أو التوصيات المقدمة أو المعتمدة من TradingView. اقرأ المزيد في شروط الاستخدام.