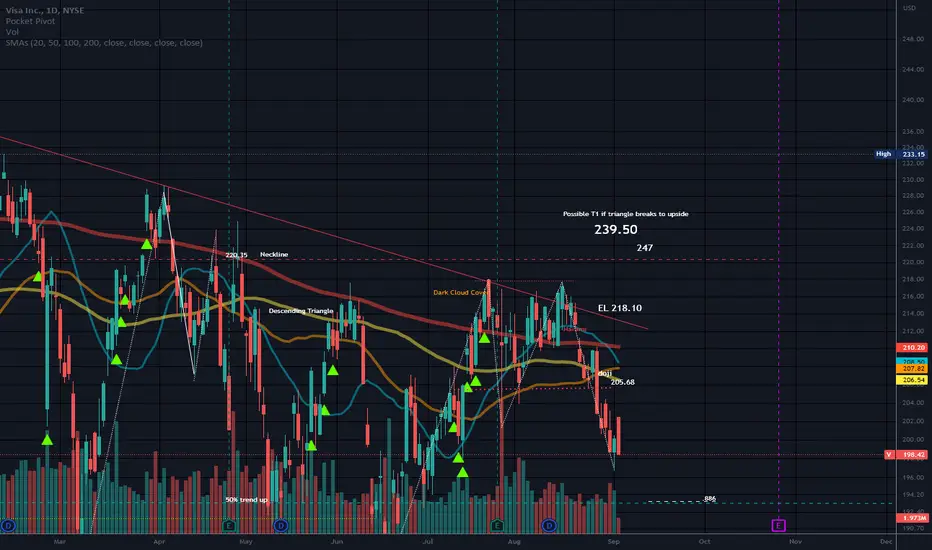
Price appears to be in a large Descending Triangle.
Neutral pattern until a trendline is broken.
Prior Head and Shoulders pattern.
Targets in orange below price are for a break of support of the triangle.
There is a Double bottom at the support line of the triangle.
Possible M structure forming. It is too early to tell.
Gaps noted below support line.
Price is still above the 50% level of the trend up measured from the Flu low.
No recommendation.
MA's chart is similar.
إخلاء المسؤولية
لا يُقصد بالمعلومات والمنشورات أن تكون، أو تشكل، أي نصيحة مالية أو استثمارية أو تجارية أو أنواع أخرى من النصائح أو التوصيات المقدمة أو المعتمدة من TradingView. اقرأ المزيد في شروط الاستخدام.
إخلاء المسؤولية
لا يُقصد بالمعلومات والمنشورات أن تكون، أو تشكل، أي نصيحة مالية أو استثمارية أو تجارية أو أنواع أخرى من النصائح أو التوصيات المقدمة أو المعتمدة من TradingView. اقرأ المزيد في شروط الاستخدام.