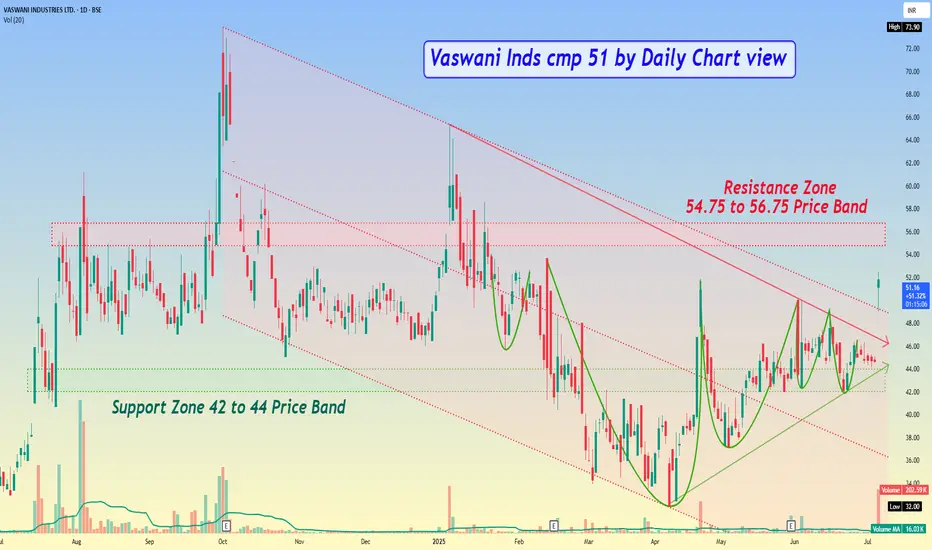
Vaswani Inds cmp 51 by Daily Chart view
- Support Zone 42 to 44 Price Band
- Resistance Zone 54.75 to 56.75 Price Band
- *Falling Parallel Price Channel Breakout done today*
- Bullish Rounding Bottoms with considerate VCP pattern too
- Heavy Volumes surge today way above average traded quantity
- *Gap Up Opening would need to be filled in and closed sooner or later on*
- *Most common Technical Indicators turning positive for BB, EMA, MACD, RSI, SAR, SuperTrend*
إخلاء المسؤولية
The information and publications are not meant to be, and do not constitute, financial, investment, trading, or other types of advice or recommendations supplied or endorsed by TradingView. Read more in the Terms of Use.
إخلاء المسؤولية
The information and publications are not meant to be, and do not constitute, financial, investment, trading, or other types of advice or recommendations supplied or endorsed by TradingView. Read more in the Terms of Use.