🔎 Overview
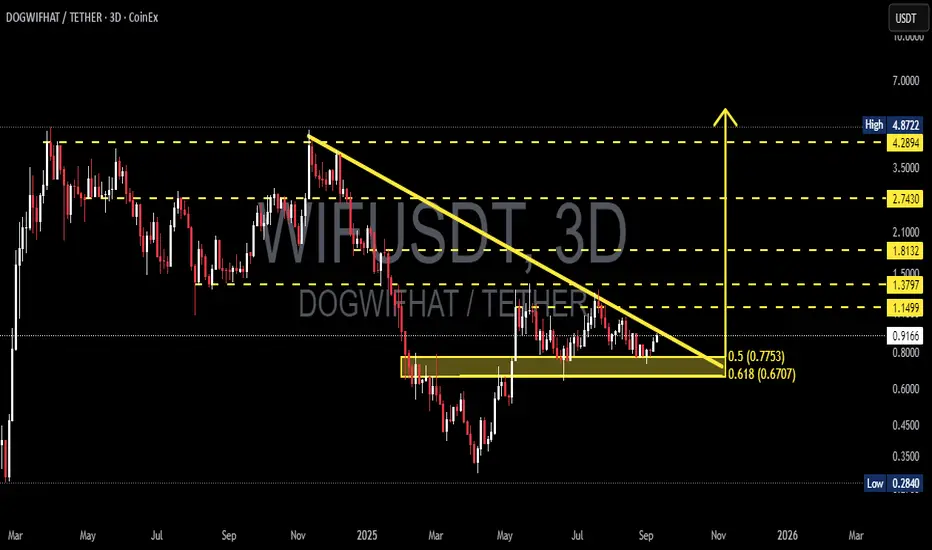
The DOGWIFHAT/USDT pair is currently consolidating at a critical junction on the 3-day timeframe (3D). The chart reveals a classic Descending Triangle — a technical pattern formed by consistent lower highs (selling pressure) converging with a strong horizontal support zone.
The essence of this pattern: price is being squeezed into a tighter range (the apex). The longer the compression, the stronger the potential explosive move — either upward or downward.
---
🟢 Bullish Scenario (Breakout Potential)
Trigger: A valid breakout requires a 3D candle close above the descending trendline and ideally a reclaim of 1.1499.
Catalyst: Strong breakout volume plus successful retest of former resistance turned into support.
Upside Targets:
1. 1.1499 → Initial breakout confirmation.
2. 1.3797 → First major upside target (+50% from current price).
3. 1.8132 → Next psychological level (+98% from current price).
4. If momentum sustains, 2.7430 → 4.2894 → 4.8722 could act as medium-term magnets.
👉 Note: As long as price holds above the golden Fibonacci pocket (0.7753–0.6707), bulls maintain a strong chance of reclaiming momentum.
---
🔴 Bearish Scenario (Breakdown Risk)
Trigger: Breakdown confirmed if the 3D candle closes below 0.6707 (Fib 0.618).
Confirmation: Failed attempt to reclaim 0.77 after breakdown.
Downside Targets:
1. 0.45 → Psychological support / liquidity area.
2. 0.2840 → Historical low.
3. Measured Move: Based on the triangle’s height (approx. 0.4792), a textbook target would be ~0.19 — though this requires heavy bearish momentum.
👉 Note: Losing the golden Fibonacci pocket would hand over full control to bears.
---
📌 Pattern & Key Significance
1. Descending Triangle → Statistically leans bearish, but strong reversals are common if broader market sentiment is bullish.
2. Fibonacci Golden Pocket (0.5–0.618: 0.7753–0.6707) → Strong confluence zone; potential accumulation area for bulls.
3. Apex Point → The closer price gets to the apex, the stronger the eventual breakout/breakdown move.
---
🧭 Trading Strategies
Bullish Traders (Breakout Players):
Enter on a confirmed 3D close above 1.1499, preferably after a retest. Target 1.38 and 1.81 with stop loss below 0.95–0.85.
Bearish Traders (Breakdown Players):
Short after a 3D close below 0.6707, with confirmation from failed retest. Targets 0.45 and 0.2840. Stop loss above 0.78.
Swing Traders (Risk-Reward Optimizers):
Consider speculative longs at 0.77–0.67 with tight SL below 0.62, aiming for potential breakout to 1.15+.
---
📊 Key Levels
Critical Support Zone: 0.7753 – 0.6707 (Fibonacci confluence).
Major Resistances: 1.1499 → 1.3797 → 1.8132 → 2.7430 → 4.2894 → 4.8722.
Historical Low: 0.2840.
Pattern: Descending Triangle → approaching resolution.
---
🚀 Conclusion
DOGWIFHAT is at a major crossroads. This descending triangle could serve as a springboard into the next altcoin rally or a trapdoor toward new lows.
The golden Fibonacci pocket (0.77–0.67) is the key battleground. If it holds, bulls have a real shot at reclaiming higher levels. If it breaks, bears will likely dominate the structure.
---
#DOGWIFHAT #WIFI #Crypto #Altcoin #ChartAnalysis #TechnicalAnalysis #DescendingTriangle #SupportResistance #Fibonacci #Breakout #Breakdown
✅ Get Free Signals! Join Our Telegram Channel Here: t.me/TheCryptoNuclear
✅ Twitter: twitter.com/crypto_nuclear
✅ Join Bybit : partner.bybit.com/b/nuclearvip
✅ Benefits : Lifetime Trading Fee Discount -50%
✅ Twitter: twitter.com/crypto_nuclear
✅ Join Bybit : partner.bybit.com/b/nuclearvip
✅ Benefits : Lifetime Trading Fee Discount -50%
إخلاء المسؤولية
لا يُقصد بالمعلومات والمنشورات أن تكون، أو تشكل، أي نصيحة مالية أو استثمارية أو تجارية أو أنواع أخرى من النصائح أو التوصيات المقدمة أو المعتمدة من TradingView. اقرأ المزيد في شروط الاستخدام.