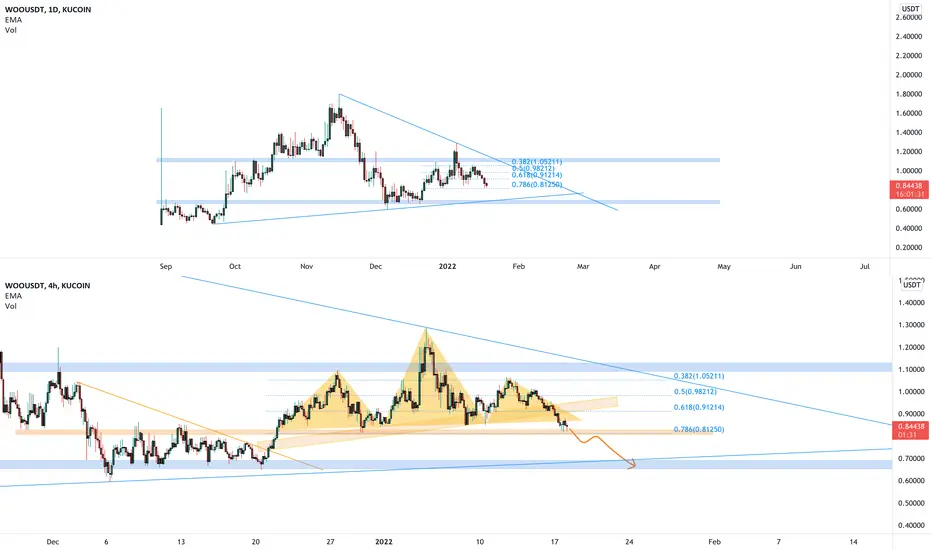
The price is creating a head and shoulders pattern on 4h timeframe and now the price is testing its neckline on the 0.786 Fibonacci level.
If the price is going to lose the support (0.81$) we could see a more continuation to the downside until the 0.7$
Of course, it's not enough to have just a breakout, you need to follow your strategy, for that reason we are following Plancton's rules.
––––
Keep in mind.
🟣 Purple structure -> Monthly structure.
🔴 Red structure -> Weekly structure.
🔵 Blue structure -> Daily structure.
🟡 Yellow structure -> 4h structure.
ملاحظة
The price created a huge head and shoulders on 4h timeframe and after the breakdown, we got a 7%.ملاحظة
The price had a breakout from the neckline and retested as new resistance.
As I said, we could see a continuation to the downside until 0.7$
ملاحظة
Head and shoulders worked!the price had a breakout triggered our strategies and we made more than 42%
ملاحظة
The price is creating a pennant below the daily resistance.
We could see a continuation if the price is going to have a new bearish breakout.
Amazing profit from our FREE CALL
ملاحظة
After the head and shoulders, the price created a pennant.If the price is going to have another breakdown from the support, we could see another bearish impulse
42% since my free signal! 👍
ملاحظة
The price is following my drawing, after a head and shoulders the price retested its neckline on 0.5 and had a bearish impulse where our students made more than 42%The price created the pennant and had a breakout and retest the previous dynamic support as new resistance.
The market is testing the 0.5 as new support, If the price is going to have a breakdown we could see a new leg down.
إخلاء المسؤولية
لا يُقصد بالمعلومات والمنشورات أن تكون، أو تشكل، أي نصيحة مالية أو استثمارية أو تجارية أو أنواع أخرى من النصائح أو التوصيات المقدمة أو المعتمدة من TradingView. اقرأ المزيد في شروط الاستخدام.
إخلاء المسؤولية
لا يُقصد بالمعلومات والمنشورات أن تكون، أو تشكل، أي نصيحة مالية أو استثمارية أو تجارية أو أنواع أخرى من النصائح أو التوصيات المقدمة أو المعتمدة من TradingView. اقرأ المزيد في شروط الاستخدام.