✨ Quick Summary:
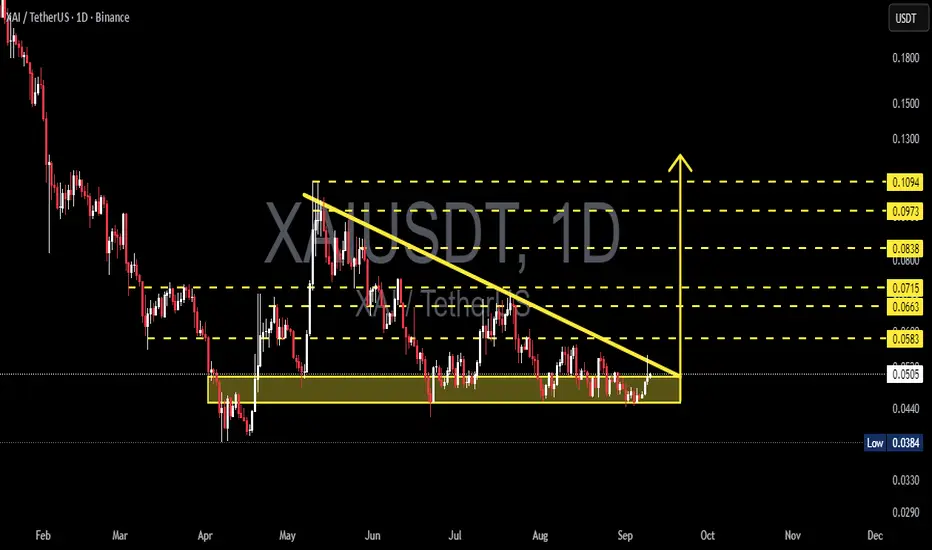
The XAI/USDT chart is now at a critical decision point. For months, price has been consolidating inside the accumulation zone (0.0384 – 0.050), while being consistently pressured by a descending trendline from above. This structure forms a descending triangle, a pattern that often signals bearish continuation, but can also act as a powerful reversal base if a breakout occurs with strong volume.
Currently, price trades around 0.0504, right at the crossroads of major support and the seller’s pressure line. This means an explosive move — either a breakout or breakdown — is likely coming soon.
---
🔎 Chart Pattern & Price Structure
Support Zone (yellow box): 0.0384 – 0.050 → tested multiple times since April 2025, showing strong buyer defense.
Descending Trendline Resistance (yellow line): connecting lower highs since May, pressing price downward.
Pattern: Classic Descending Triangle → market is coiling tighter, awaiting a catalyst.
Market Psychology:
Buyers keep defending the same support.
Sellers consistently lower their asking prices.
This tug-of-war is reaching its breaking point.
---
🚀 Bullish Scenario (Breakout)
Key confirmation:
Daily close above the descending trendline.
Breakout and daily close above 0.0583 with significant volume.
Potential upside targets (layered resistances):
🎯 Target 1: 0.0583 (+15%)
🎯 Target 2: 0.0663 (+31%)
🎯 Target 3: 0.0715 (+42%)
🎯 Target 4: 0.0838 (+66%)
🎯 Target 5: 0.0973 (+93%)
🎯 Ambitious Target: 0.1094 (+117%)
Trading notes:
Strong breakouts often come with at least 2x average daily volume. The ideal setup is breakout → retest (turning resistance into support) → continuation. Conservative entries can wait for the retest confirmation above 0.0583.
---
⚠️ Bearish Scenario (Breakdown)
Key confirmation: daily close below 0.0384 with a full-bodied candle and high volume.
Downside risk:
Retest of the psychological support zone 0.033 – 0.030.
Breakdown here would likely extend the broader bearish trend, potentially setting new lows.
Trading notes:
A breakdown with volume often triggers panic selling. In this case, stop-losses for longs become crucial. Aggressive traders may consider shorts after a failed retest of broken support.
---
🔑 Extra Confirmation Factors
1. Volume: No volume = no trust in breakout/breakdown.
2. RSI / Momentum: Bullish divergence supports a breakout, bearish divergence confirms breakdown.
3. Market Sentiment: If BTC/ETH trend bullish, XAI’s breakout chances improve. A weak crypto market favors breakdown.
4. Fundamental Catalysts: Partnerships, project updates, or listings can flip the technical outlook.
---
📌 Conclusion
XAI/USDT is facing a make-or-break moment:
Bullish breakout could open a +40% to +100% rally.
Bearish breakdown could drag price back to the 0.030–0.033 zone.
For traders: this is the time to wait for confirmation. Entering too early in such a setup carries high risk. The best positions often come after the market chooses its direction.
---
#XAI #XAIUSDT #CryptoAnalysis #TechnicalAnalysis #DescendingTriangle #Altcoin #Breakout #SupportResistance #CryptoTrading
✅ Get Free Signals! Join Our Telegram Channel Here: t.me/TheCryptoNuclear
✅ Twitter: twitter.com/crypto_nuclear
✅ Join Bybit : partner.bybit.com/b/nuclearvip
✅ Benefits : Lifetime Trading Fee Discount -50%
✅ Twitter: twitter.com/crypto_nuclear
✅ Join Bybit : partner.bybit.com/b/nuclearvip
✅ Benefits : Lifetime Trading Fee Discount -50%
إخلاء المسؤولية
لا يُقصد بالمعلومات والمنشورات أن تكون، أو تشكل، أي نصيحة مالية أو استثمارية أو تجارية أو أنواع أخرى من النصائح أو التوصيات المقدمة أو المعتمدة من TradingView. اقرأ المزيد في شروط الاستخدام.