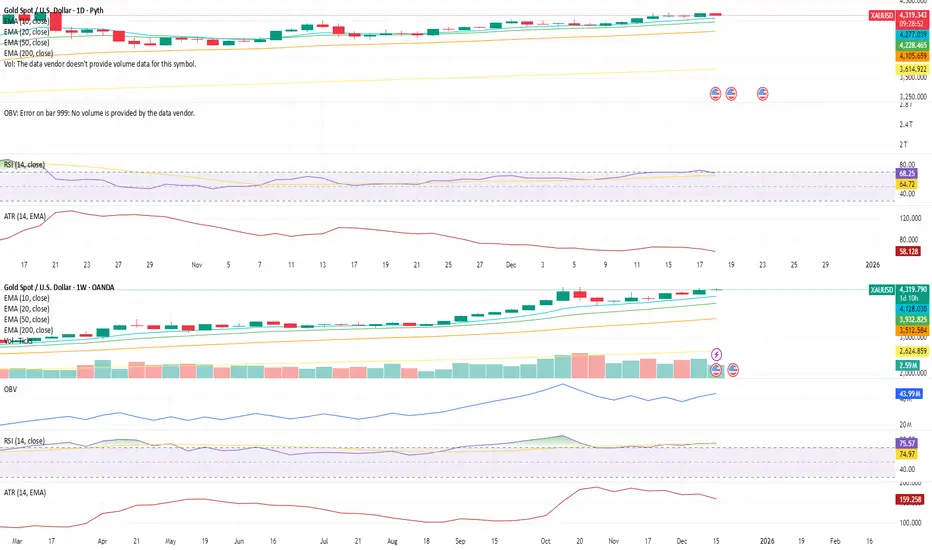
1D Chart (Daily)
Gold continues to trade above all key EMAs, with the 10 EMA leading and holding steady, reinforcing short-term structural support rather than impulsive momentum.
RSI is taking a brief breather but remains elevated near 68, suggesting momentum is cooling in a controlled manner rather than breaking down.
ATR remains flat, indicating volatility is contained and price is progressing in an orderly fashion rather than expanding aggressively.
Due to the nature of spot gold volume, OBV on the daily timeframe is less informative, and participation signals are better assessed from the higher-timeframe structure.
Overall, the daily chart reflects consolidation within strength, not distribution.
1W Chart (Weekly)
The weekly structure continues to support the broader bullish framework.
Price remains above all major EMAs, with the 10 and 20 EMA rising steadily — not steep, but clearly directional — reinforcing sustainable trend progression rather than late-stage acceleration.
OBV trends higher on the weekly, signaling healthy participation and accumulation beneath the surface.
RSI holds near 75, elevated yet stable, indicating persistent strength without signs of exhaustion.
ATR remains flat, confirming that volatility remains controlled even as price holds elevated levels.
The weekly structure confirms that gold remains constructive and supported, with no technical evidence of breakdown.
⭐ Final Clarity Note ⭐
In structurally strong markets, consolidation often appears before continuation, not after failure.
When price holds above trend EMAs, volatility remains compressed, and participation persists on higher timeframes, it typically reflects positioning rather than speculation.
Gold’s current structure suggests the market is digesting gains, not abandoning them.
إخلاء المسؤولية
لا يُقصد بالمعلومات والمنشورات أن تكون، أو تشكل، أي نصيحة مالية أو استثمارية أو تجارية أو أنواع أخرى من النصائح أو التوصيات المقدمة أو المعتمدة من TradingView. اقرأ المزيد في شروط الاستخدام.
إخلاء المسؤولية
لا يُقصد بالمعلومات والمنشورات أن تكون، أو تشكل، أي نصيحة مالية أو استثمارية أو تجارية أو أنواع أخرى من النصائح أو التوصيات المقدمة أو المعتمدة من TradingView. اقرأ المزيد في شروط الاستخدام.