Gold has been trading in a 3250-3450 range since the middle of May, but events last week saw prices test and close right at the top of that range on Friday. The drivers impacting this push higher in Gold, which could remain in play for traders in the first week of September, were numerous. These included President Trump’s on-going challenge of Federal Reserve independence with the attempted firing of Governor Cook, Russia demanding more to achieve progress towards a ceasefire to the war in Ukraine, as well as stubborn US inflation (PCE Index last Friday) and resilient economic data at a time when the Federal Reserve are expected to cut interest rates at their next meeting on September 17th.
Early trading on Monday has now seen price strength extend, leading to a range breakout (more on this in technical update below) as traders react to news released late on Friday that a US appeals court ruled President Trump's reciprocal tariffs illegal. While the ruling, released after the markets closed, left the tariffs in place ahead of a final showdown at the US Supreme Court, the uncertainty this potentially provides regarding President Trump’s approach to foreign policy has seen Gold prices touch a 4 month high of 3490 (at time of writing 0800 BST).
Looking forward, this week is stacked full of risk events that could lead to an increase in Gold price volatility, including important US economic data, with the ISM Manufacturing (Tuesday) and Services (Thursday) PMI survey readings and then the all-important Non-farm payrolls release on Friday. All of which could impact the expectations of traders for a Fed rate cut later in the month.
It could be a busy start to September!
Technical Update: Range Breakout?
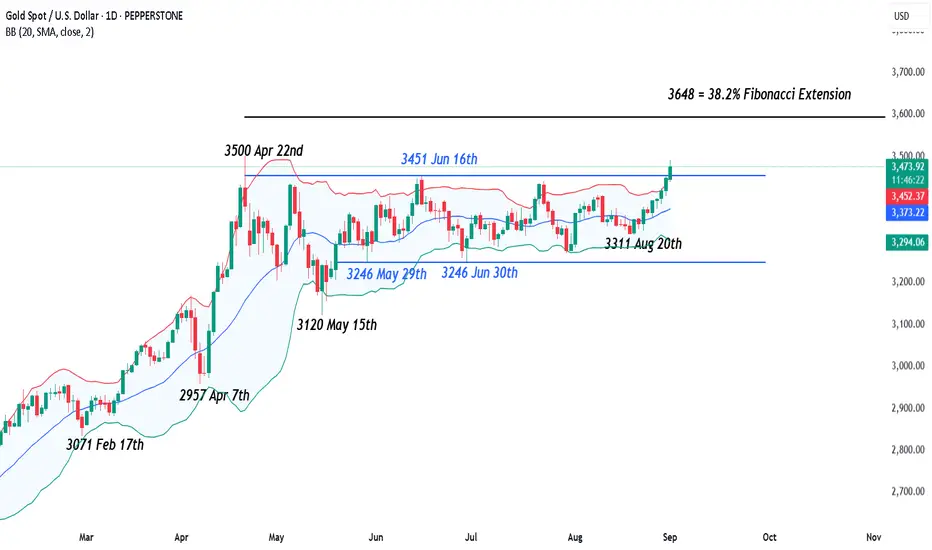
Since mid-May 2025, Gold had adopted a more balanced tone, forming a sideways trading range in price activity. This range was defined by the June 16th high at 3451 and the 3246 lows recorded on May 29th and June 30th.

However, as the chart above shows, the latest price strength, which has extended so far this morning, is seeing breaks above the 3451 June 16th high, reflecting possibilities of a breakout to the upside in Gold prices.
The key question now is whether this breakout from the range is confirmed on a closing basis leading to possibilities of a further phase of price strength, or weakness develops over the balance of Monday’s session, to see a prices settle back under the 3451 level..
While it is impossible to predict if an upside breakout from a sideways range will be confirmed or not, a close above the resistance is required to suggest such possibilities. In the case of Gold, confirmation of this morning’s breakout would require a close above the 3451 resistance level.
It should be remembered, a breakout in either direction from a sideways range, may lead to an acceleration in price movement, due to what’s called the supply and demand vacuum.
Supply and demand vacuums form when traders become impatient waiting for their orders to trigger above a resistance or below a support of the on-going range. This impatience can lead them to adjust their orders, lowering sell orders to just below resistance or raising buy orders to just above support.
When traders shift orders into the range, raising bids above support or lowering offers below resistance, it can reinforce the strength of those levels and prolong the range. However, this also creates price zones just above and below the range with few active orders left. If a breakout occurs, the lack of immediate liquidity can lead to a sharp price acceleration until the next cluster of buy orders (on the downside) or sell orders (on the upside) are reached.
A reason for this morning’s initial acceleration higher in the price of Gold after the break above 3451, may be due to a supply vacuum above the resistance level. However, tonight’s closing level could also be an important focus for traders.
While not a guarantee of further strength, a close above the 3451 resistance may be seen by traders as a positive move, potentially paving the way for further gains in Gold.
A close above the 3451 resistance could signal a move toward the April 22nd all-time high at 3500. If breached, the next resistance may then be 3648, marked by the 38.2% Fibonacci extension.
For downside risks to re-emerge, which could suggest this morning’s move higher may be a false break of the 3451 resistance, traders could now be focusing on 3420, which is equal to the 38.2% Fibonacci retracement of latest price strength.

A close below this 3420 support, if seen, could trigger further weakness, potentially to retest 3380, the deeper 61.8% retracement, even then the August 20th low at 3311.
Pepperstone doesn’t represent that the material provided here is accurate, current or complete, and therefore shouldn’t be relied upon as such. The information, whether from a third party or not, isn’t to be considered as a recommendation; or an offer to buy or sell; or the solicitation of an offer to buy or sell any security, financial product or instrument; or to participate in any particular trading strategy. It does not take into account readers’ financial situation or investment objectives. We advise any readers of this content to seek their own advice. Without the approval of Pepperstone, reproduction or redistribution of this information isn’t permitted.
Early trading on Monday has now seen price strength extend, leading to a range breakout (more on this in technical update below) as traders react to news released late on Friday that a US appeals court ruled President Trump's reciprocal tariffs illegal. While the ruling, released after the markets closed, left the tariffs in place ahead of a final showdown at the US Supreme Court, the uncertainty this potentially provides regarding President Trump’s approach to foreign policy has seen Gold prices touch a 4 month high of 3490 (at time of writing 0800 BST).
Looking forward, this week is stacked full of risk events that could lead to an increase in Gold price volatility, including important US economic data, with the ISM Manufacturing (Tuesday) and Services (Thursday) PMI survey readings and then the all-important Non-farm payrolls release on Friday. All of which could impact the expectations of traders for a Fed rate cut later in the month.
It could be a busy start to September!
Technical Update: Range Breakout?
Since mid-May 2025, Gold had adopted a more balanced tone, forming a sideways trading range in price activity. This range was defined by the June 16th high at 3451 and the 3246 lows recorded on May 29th and June 30th.
However, as the chart above shows, the latest price strength, which has extended so far this morning, is seeing breaks above the 3451 June 16th high, reflecting possibilities of a breakout to the upside in Gold prices.
The key question now is whether this breakout from the range is confirmed on a closing basis leading to possibilities of a further phase of price strength, or weakness develops over the balance of Monday’s session, to see a prices settle back under the 3451 level..
While it is impossible to predict if an upside breakout from a sideways range will be confirmed or not, a close above the resistance is required to suggest such possibilities. In the case of Gold, confirmation of this morning’s breakout would require a close above the 3451 resistance level.
It should be remembered, a breakout in either direction from a sideways range, may lead to an acceleration in price movement, due to what’s called the supply and demand vacuum.
Supply and demand vacuums form when traders become impatient waiting for their orders to trigger above a resistance or below a support of the on-going range. This impatience can lead them to adjust their orders, lowering sell orders to just below resistance or raising buy orders to just above support.
When traders shift orders into the range, raising bids above support or lowering offers below resistance, it can reinforce the strength of those levels and prolong the range. However, this also creates price zones just above and below the range with few active orders left. If a breakout occurs, the lack of immediate liquidity can lead to a sharp price acceleration until the next cluster of buy orders (on the downside) or sell orders (on the upside) are reached.
A reason for this morning’s initial acceleration higher in the price of Gold after the break above 3451, may be due to a supply vacuum above the resistance level. However, tonight’s closing level could also be an important focus for traders.
While not a guarantee of further strength, a close above the 3451 resistance may be seen by traders as a positive move, potentially paving the way for further gains in Gold.
A close above the 3451 resistance could signal a move toward the April 22nd all-time high at 3500. If breached, the next resistance may then be 3648, marked by the 38.2% Fibonacci extension.
For downside risks to re-emerge, which could suggest this morning’s move higher may be a false break of the 3451 resistance, traders could now be focusing on 3420, which is equal to the 38.2% Fibonacci retracement of latest price strength.
A close below this 3420 support, if seen, could trigger further weakness, potentially to retest 3380, the deeper 61.8% retracement, even then the August 20th low at 3311.
Pepperstone doesn’t represent that the material provided here is accurate, current or complete, and therefore shouldn’t be relied upon as such. The information, whether from a third party or not, isn’t to be considered as a recommendation; or an offer to buy or sell; or the solicitation of an offer to buy or sell any security, financial product or instrument; or to participate in any particular trading strategy. It does not take into account readers’ financial situation or investment objectives. We advise any readers of this content to seek their own advice. Without the approval of Pepperstone, reproduction or redistribution of this information isn’t permitted.
Global risk Warning CFDs are complex instruments and come with a high risk of losing money rapidly due to leverage. Between 74-89% of retail investor accounts lose money when trading in CFDs. You should consider whether you understand how CFD
إخلاء المسؤولية
لا يُقصد بالمعلومات والمنشورات أن تكون، أو تشكل، أي نصيحة مالية أو استثمارية أو تجارية أو أنواع أخرى من النصائح أو التوصيات المقدمة أو المعتمدة من TradingView. اقرأ المزيد في شروط الاستخدام.