✅From the 4H chart, gold surged sharply to a high of 4206.57 before experiencing a strong pullback, forming a long upper shadow. This indicates that bullish momentum weakened after testing resistance around the upper Bollinger Band (4203.88).
The current price is trading around 4190–4195, slightly above the MA10 (4133.81) and close to the Bollinger midline (4099.50) — this area serves as a short-term support zone. The MA5 (4140.23) remains above MA10, showing that the broader trend is still upward, but the sudden bearish candle signals short-term correction pressure.
The uptrend remains intact on the 4H timeframe, but the rejection near 4206 signals exhaustion of short-term buying power. If gold fails to reclaim 4200, a temporary pullback toward 4130–4100 is likely before another potential rise.
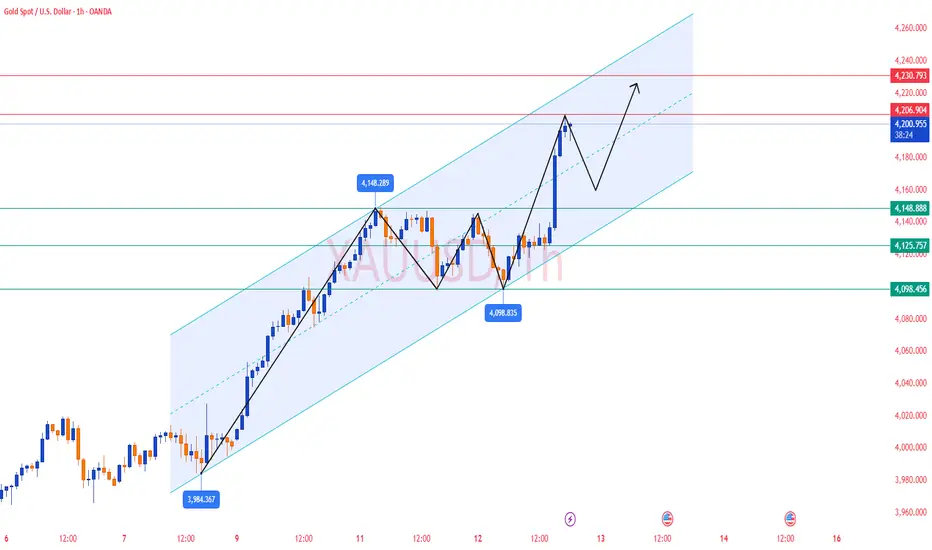
✅ On the 1H chart, gold spiked to 4206, then quickly reversed, forming a bearish engulfing candle. This reflects profit-taking pressure from intraday bulls.
The Bollinger Bands are widening, indicating increased volatility, and the price is currently testing the midline (4138.49) as a short-term pivot.
The MA5 (4181.73) is crossing below the MA10 (4154.48), forming a short-term bearish crossover, suggesting that gold may consolidate or correct slightly before resuming any uptrend.
MACD is showing early signs of divergence, with the histogram turning down after a strong expansion, confirming that momentum is cooling off.
🔴 Resistance levels: 4203–4206 / 4215–4230
🟢 Support levels: 4150–4155 / 4130–4138
✅ Trading Strategy Reference
🔰 If gold rebounds to 4200–4210 and shows resistance, consider taking light short positions, targeting 4150–4130, with a stop loss above 4220.
🔰 If gold drops to 4130–4140 and stabilizes, consider taking long positions, targeting 4180–4200.
📈 Summary:
Gold remains in a broader bullish structure, but short-term charts indicate correction pressure after the surge to 4206.
In the near term, focus on the 4100–4210 range.
Adopt a “sell high, buy low” approach — wait for retracement confirmation before entering new positions, and avoid chasing price near resistance levels.
The current price is trading around 4190–4195, slightly above the MA10 (4133.81) and close to the Bollinger midline (4099.50) — this area serves as a short-term support zone. The MA5 (4140.23) remains above MA10, showing that the broader trend is still upward, but the sudden bearish candle signals short-term correction pressure.
The uptrend remains intact on the 4H timeframe, but the rejection near 4206 signals exhaustion of short-term buying power. If gold fails to reclaim 4200, a temporary pullback toward 4130–4100 is likely before another potential rise.
✅ On the 1H chart, gold spiked to 4206, then quickly reversed, forming a bearish engulfing candle. This reflects profit-taking pressure from intraday bulls.
The Bollinger Bands are widening, indicating increased volatility, and the price is currently testing the midline (4138.49) as a short-term pivot.
The MA5 (4181.73) is crossing below the MA10 (4154.48), forming a short-term bearish crossover, suggesting that gold may consolidate or correct slightly before resuming any uptrend.
MACD is showing early signs of divergence, with the histogram turning down after a strong expansion, confirming that momentum is cooling off.
🔴 Resistance levels: 4203–4206 / 4215–4230
🟢 Support levels: 4150–4155 / 4130–4138
✅ Trading Strategy Reference
🔰 If gold rebounds to 4200–4210 and shows resistance, consider taking light short positions, targeting 4150–4130, with a stop loss above 4220.
🔰 If gold drops to 4130–4140 and stabilizes, consider taking long positions, targeting 4180–4200.
📈 Summary:
Gold remains in a broader bullish structure, but short-term charts indicate correction pressure after the surge to 4206.
In the near term, focus on the 4100–4210 range.
Adopt a “sell high, buy low” approach — wait for retracement confirmation before entering new positions, and avoid chasing price near resistance levels.
إخلاء المسؤولية
The information and publications are not meant to be, and do not constitute, financial, investment, trading, or other types of advice or recommendations supplied or endorsed by TradingView. Read more in the Terms of Use.
إخلاء المسؤولية
The information and publications are not meant to be, and do not constitute, financial, investment, trading, or other types of advice or recommendations supplied or endorsed by TradingView. Read more in the Terms of Use.