Gold Technical Analysis and Trading Strategy (November 19th)
Market Review: Yesterday, the gold market showed a bottoming-out and rebound trend. After testing the support level of 3998, the price stabilized and rebounded. In the evening, it broke through the key resistance level of 4030, officially turning into a bullish pattern. Subsequently, after a second pullback to the 4029 support level, it launched a strong rally, reaching a high of 4082. The daily chart ultimately closed with a small bullish candlestick with a relatively long lower shadow, ending the previous three-day losing streak. This candlestick pattern indicates that after a fierce battle between bulls and bears, the bulls have regained dominance.
Technical Analysis
From a daily chart perspective, although yesterday's positive close alleviated short-term downward pressure, the overall technical pattern still presents some concerns:
The short-term moving average system above still provides significant resistance, and the price has not yet achieved a substantial breakout.
After three consecutive days of negative closes, the rebound of this single positive candle is more likely a technical correction.
The price retraced again in the morning session, indicating that the bullish momentum still needs further confirmation.
Key Levels Analysis:
Support Area: Around 4050 (a support/resistance level), this level will be the watershed between bulls and bears today.
Resistance Area: 4100-4105 (the previous high of the negative candle), this is a significant short-term resistance zone.
Trading Strategy
Operational Approach: Primarily buy on dips, secondarily sell on rallies.
Specific Layout Long Position Strategy: Buy in batches in the 4050-4055 range, with a position size of 20% and a stop loss of 8 points. Target levels are 4080-4100, with a potential further upside to 4110 if the price breaks through.
Short Position Strategy: Sell in batches in the 4100-4105 range, with a position size of 20% and a stop loss of 8 points. Target levels are 4080-4060, with a potential further downside to the 4050 support level if the price breaks below.
Risk Warning: The impact of the Fed meeting minutes should be closely monitored today.
The non-farm payroll data will be released on Thursday and may have a significant impact on the market.
Strictly adhere to position management; the stop loss for each trade should not exceed 8% of the position size.
Specific entry points should be adjusted flexibly based on real-time market movements.
تم فتح الصفقة
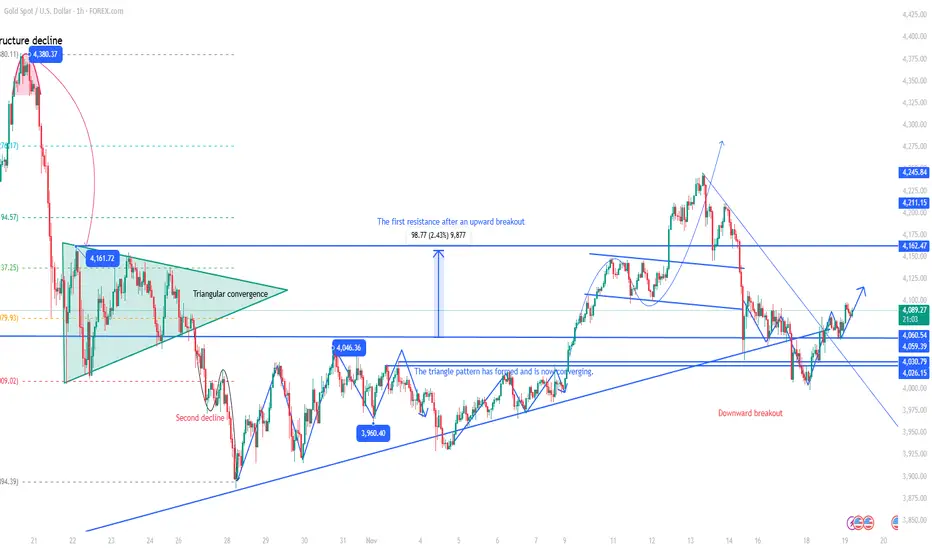
Gold Short-Term Technical Analysis and Trading Strategy
Market Characteristics Analysis
From the 1-hour chart, gold's technical pattern exhibits the following characteristics:
The moving average system has formed a clear bullish alignment, with short-term moving averages turning upwards.
The price has successfully broken through and stabilized above the key psychological level of 4100.
Currently, it is maintaining a steady upward channel with good volume support.
Key Levels Analysis
Recent Support: 4090 area (a support/resistance level after a breakout)
Secondary Support: 4070-4080 range
Upside Target: 4150-4160 area
Risk Control: Below 4058 (bullish defense line)
Trading Logic Analysis
Current Market The market is exhibiting a clear bullish pattern, with the following technical signals:
* Continued upward momentum after breaking through key resistance
* Moving average system supporting a stepped price increase
* Volume and price action indicate sustained buying power
Trading Recommendations
* Trading Plan:
* Entry Area: Establish long positions in batches within the 4090-4100 range
* Stop-loss order placed below 4070
* Target Levels: Primary target 4130, extended target 4150
* Position Management: Initial position size recommended not to exceed 20%
Risk Warning
The market is always in flux; traders should remain flexible:
* Avoid rigid bullish or bearish thinking; adjust accordingly to market rhythm
* Monitor momentum changes; be wary of pullback risks if volume and price diverge
* Manage position risk carefully before and after important data releases.
أغلقت الصفقة: تم الوصول للهدف
Gold Market Analysis and Trading Strategy
Market Review: Gold surged to a high of 4130 during the Asian and European sessions, and our long position at 4100 successfully captured a 30-point profit. Subsequently, the price experienced a rapid pullback and is currently testing the key technical support area below.
Technical Analysis
Current Market Characteristics:
Support Confirmation: The 4050 level shows a clear support effect, with the price showing signs of stopping its decline in this area.
Pullback Nature: This pullback is a technical correction after a strong upward move; the overall bullish trend remains unchanged.
Momentum Assessment: Short-term downward momentum is weakening, and signs of stabilization are gradually emerging.
Key Level Analysis:
Strong Support Zone: 4050-4040 area (multiple technical support levels)
Upside Target: 4070→4090→4100 (stepped resistance levels)
Risk Control: Below 4025 (key support level breached)
Trading Strategy: Bullish Trading Strategy:
Entry Area: Establish long positions in batches within the 4050-4040 range.
Stop-Loss Setting: Below 4025
Target Levels:
First Target: 4070
Second Target: 4090
Third Target: 4100
Positioning Recommendation: A phased entry strategy is recommended, with total position size kept within a reasonable range.
Risk Warning: Monitor the effectiveness of the 4050 support level. If it breaks below 4025, the trend needs to be reassessed.
US economic data may trigger increased volatility.
A gradual profit-taking strategy is recommended to protect existing profits.
Note: Increased market volatility necessitates flexible adjustments from traders. This analysis is based on the current market situation; specific operations should be adjusted according to real-time market movements.
✅ 𝐃𝐚𝐢𝐥𝐲 𝟐-𝟒 𝐓𝐫𝐚𝐝𝐢𝐧𝐠 𝐒𝐢𝐠𝐧𝐚𝐥𝐬 🔥
✅ 𝐇𝐢𝐠𝐡 𝐀𝐜𝐜𝐮𝐫𝐚𝐜𝐲 𝟗𝟎%-𝟗𝟓% 🔥
✅ 𝐌𝐨𝐧𝐭𝐡𝐥𝐲 𝐏𝐫𝐨𝐟𝐢𝐭 𝟑𝟓𝟎𝟎 𝐏𝐈𝐏𝐒 🔥
💎 𝐏𝐫𝐨𝐟𝐞𝐬𝐬𝐢𝐨𝐧𝐚𝐥 𝐂𝐡𝐚𝐧𝐧𝐞𝐥:
t.me/+pu_eE6peovU5NDIx
✅ 𝐇𝐢𝐠𝐡 𝐀𝐜𝐜𝐮𝐫𝐚𝐜𝐲 𝟗𝟎%-𝟗𝟓% 🔥
✅ 𝐌𝐨𝐧𝐭𝐡𝐥𝐲 𝐏𝐫𝐨𝐟𝐢𝐭 𝟑𝟓𝟎𝟎 𝐏𝐈𝐏𝐒 🔥
💎 𝐏𝐫𝐨𝐟𝐞𝐬𝐬𝐢𝐨𝐧𝐚𝐥 𝐂𝐡𝐚𝐧𝐧𝐞𝐥:
t.me/+pu_eE6peovU5NDIx
إخلاء المسؤولية
The information and publications are not meant to be, and do not constitute, financial, investment, trading, or other types of advice or recommendations supplied or endorsed by TradingView. Read more in the Terms of Use.