✅ 4H Chart Trend Analysis
1️⃣ Lower rebound highs, weakening bullish momentum
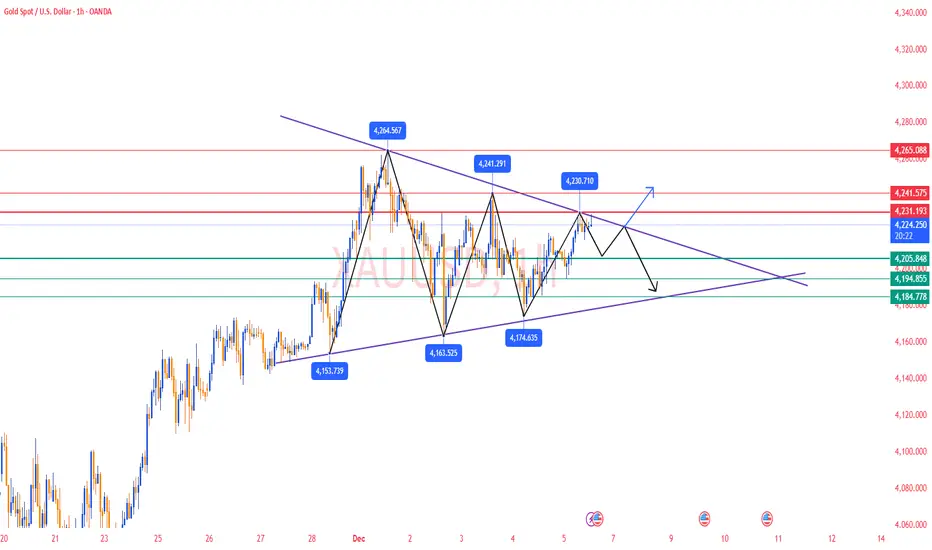
Highs are stepping down from 4264.62 → 4241.55 → 4230, showing repeated rejection and forming an early descending high structure at the top.
2️⃣ Bollinger Middle Band as strong resistance
Current rebound is capped around 4227 mid-band
➡️ If price continues to fail breaking above → mid-term remains in consolidation
3️⃣ Moving averages indicate weak recovery
MA5 & MA10 are turning upward, but MA20 is flat
➡️ This suggests rebound = correction, not reversal
If price fails to break 4241–4245, strong bullish momentum will not be restored.
✅ 1H Chart Trend Analysis
1️⃣ Consecutive closes below 4227 with long upper shadows
➡ Bullish profit-taking at high levels
➡ Clear overhead selling pressure
2️⃣ Short-term MAs converging
MA5 / MA10 / MA20 are compressing together
➡ Momentum weakening → entering sideways consolidation
3️⃣ Bollinger Bands turning sideways
Price failing to ride the upper band → easy to shift into pullback mode
🔴 Resistance Levels :4227–4230 / 4240–4245
🟢 Support Levels:4205–4208 / 4185–4180
✅Trading Strategy Reference
🔰 Main Strategy: Sell the Rebound
📍Entry Zone: 4225–4230
🎯Targets: 4210 / 4195 / 4185
⛔Stop-loss: Above 4235
🔰 Secondary Strategy: Buy the Dip
📍If 4205–4208 holds, consider light longs
🎯Targets: 4220 / 4227
⛔Stop-loss: Below 4198
📌 Trend Summary
1️⃣ If 4205 breaks with strong selling volume → downside targets: 4188 / 4163
2️⃣ If price stabilizes above 4227 with bullish volume →
Bulls regain control → target 4245+
🎯 Key focus: Whether the 4205–4208 support zone remains intact
🔥Trading Reminder: Trading strategies are time-sensitive, and market conditions can change rapidly. Please adjust your trading plan based on real-time market conditions.
1️⃣ Lower rebound highs, weakening bullish momentum
Highs are stepping down from 4264.62 → 4241.55 → 4230, showing repeated rejection and forming an early descending high structure at the top.
2️⃣ Bollinger Middle Band as strong resistance
Current rebound is capped around 4227 mid-band
➡️ If price continues to fail breaking above → mid-term remains in consolidation
3️⃣ Moving averages indicate weak recovery
MA5 & MA10 are turning upward, but MA20 is flat
➡️ This suggests rebound = correction, not reversal
If price fails to break 4241–4245, strong bullish momentum will not be restored.
✅ 1H Chart Trend Analysis
1️⃣ Consecutive closes below 4227 with long upper shadows
➡ Bullish profit-taking at high levels
➡ Clear overhead selling pressure
2️⃣ Short-term MAs converging
MA5 / MA10 / MA20 are compressing together
➡ Momentum weakening → entering sideways consolidation
3️⃣ Bollinger Bands turning sideways
Price failing to ride the upper band → easy to shift into pullback mode
🔴 Resistance Levels :4227–4230 / 4240–4245
🟢 Support Levels:4205–4208 / 4185–4180
✅Trading Strategy Reference
🔰 Main Strategy: Sell the Rebound
📍Entry Zone: 4225–4230
🎯Targets: 4210 / 4195 / 4185
⛔Stop-loss: Above 4235
🔰 Secondary Strategy: Buy the Dip
📍If 4205–4208 holds, consider light longs
🎯Targets: 4220 / 4227
⛔Stop-loss: Below 4198
📌 Trend Summary
1️⃣ If 4205 breaks with strong selling volume → downside targets: 4188 / 4163
2️⃣ If price stabilizes above 4227 with bullish volume →
Bulls regain control → target 4245+
🎯 Key focus: Whether the 4205–4208 support zone remains intact
🔥Trading Reminder: Trading strategies are time-sensitive, and market conditions can change rapidly. Please adjust your trading plan based on real-time market conditions.
✅ 𝐃𝐚𝐢𝐥𝐲 𝟐-𝟒 𝐓𝐫𝐚𝐝𝐢𝐧𝐠 𝐒𝐢𝐠𝐧𝐚𝐥𝐬 🔥
✅ 𝐇𝐢𝐠𝐡 𝐀𝐜𝐜𝐮𝐫𝐚𝐜𝐲 𝟗𝟎%-𝟗𝟓% 🔥
✅ 𝐌𝐨𝐧𝐭𝐡𝐥𝐲 𝐏𝐫𝐨𝐟𝐢𝐭 𝟑𝟓𝟎𝟎 𝐏𝐈𝐏𝐒 🔥
💎 𝐏𝐫𝐨𝐟𝐞𝐬𝐬𝐢𝐨𝐧𝐚𝐥 𝐅𝐫𝐞𝐞 𝐆𝐫𝐨𝐮𝐩:t.me/+YgFaky2XQ7ViYWE9
✅ 𝐇𝐢𝐠𝐡 𝐀𝐜𝐜𝐮𝐫𝐚𝐜𝐲 𝟗𝟎%-𝟗𝟓% 🔥
✅ 𝐌𝐨𝐧𝐭𝐡𝐥𝐲 𝐏𝐫𝐨𝐟𝐢𝐭 𝟑𝟓𝟎𝟎 𝐏𝐈𝐏𝐒 🔥
💎 𝐏𝐫𝐨𝐟𝐞𝐬𝐬𝐢𝐨𝐧𝐚𝐥 𝐅𝐫𝐞𝐞 𝐆𝐫𝐨𝐮𝐩:t.me/+YgFaky2XQ7ViYWE9
إخلاء المسؤولية
لا يُقصد بالمعلومات والمنشورات أن تكون، أو تشكل، أي نصيحة مالية أو استثمارية أو تجارية أو أنواع أخرى من النصائح أو التوصيات المقدمة أو المعتمدة من TradingView. اقرأ المزيد في شروط الاستخدام.