Gold Technical Strategy: Bullish Structure Intact, High-Cost-Effective Long Opportunities Available
On the daily chart, gold trades within an ascending channel with short-term moving averages in a bullish alignment. The 20-day moving average converges with the ascending trend line to form resonant support, reinforcing the upward bias.
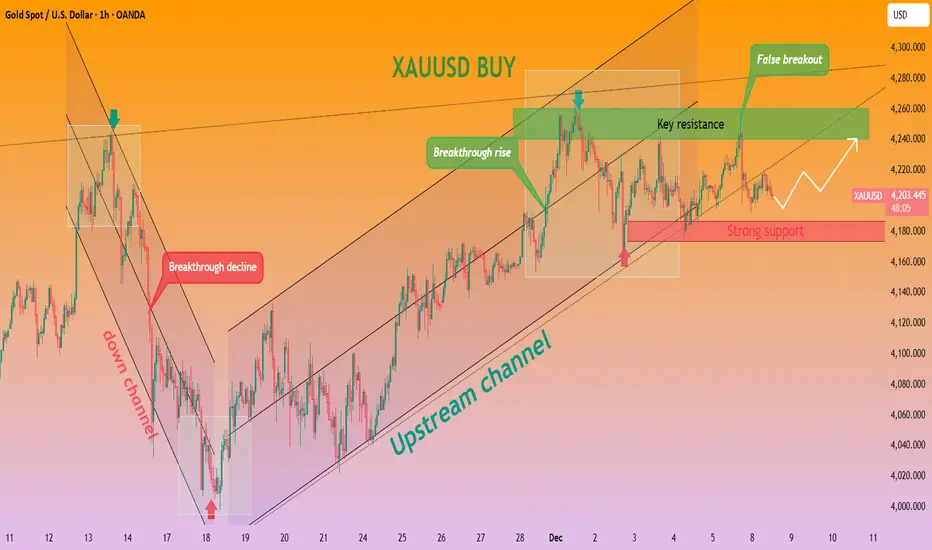
The 4-hour chart reveals a triangular consolidation pattern around the $4,200 level — a classic continuation signal of an uptrend, indicating accumulation of bullish momentum before the next move.
Clear Key Levels
Resistance Zones:
Short-term resistance: $4,230–$4,240 (upper edge of the triangle + previous high-volume trading zone).
Support Zones:
Immediate support: $4,180 (lower edge of the triangle + 5-day moving average).
Strong support: $4,170 (previous stabilization level, with solid buying interest).
Indicator Signals Confirm Bullish Bias
MACD: Remains above the zero line; although momentum has slightly contracted, there are no signs of a trend reversal, indicating sustained bullish dominance.
RSI: Trades in the neutral range, suggesting limited room for pullback and balanced market sentiment.
Current price levels offer favorable risk-reward for long positions, with clear support levels to limit downside and a consolidation pattern signaling potential upside momentum.
Gold trading strategy
buy:4190-4200
tp:4210-4220-4240
sl:4180
On the daily chart, gold trades within an ascending channel with short-term moving averages in a bullish alignment. The 20-day moving average converges with the ascending trend line to form resonant support, reinforcing the upward bias.
The 4-hour chart reveals a triangular consolidation pattern around the $4,200 level — a classic continuation signal of an uptrend, indicating accumulation of bullish momentum before the next move.
Clear Key Levels
Resistance Zones:
Short-term resistance: $4,230–$4,240 (upper edge of the triangle + previous high-volume trading zone).
Support Zones:
Immediate support: $4,180 (lower edge of the triangle + 5-day moving average).
Strong support: $4,170 (previous stabilization level, with solid buying interest).
Indicator Signals Confirm Bullish Bias
MACD: Remains above the zero line; although momentum has slightly contracted, there are no signs of a trend reversal, indicating sustained bullish dominance.
RSI: Trades in the neutral range, suggesting limited room for pullback and balanced market sentiment.
Current price levels offer favorable risk-reward for long positions, with clear support levels to limit downside and a consolidation pattern signaling potential upside momentum.
Gold trading strategy
buy:4190-4200
tp:4210-4220-4240
sl:4180
تم فتح الصفقة
Confirming the bullish signal💹💹💹Trading strategies and analysis: Gold, BTC, crude oil, foreign exchange, etc.
📶📶📶Free trading signals:t.me/+EbXVM-CStnFmNjBk
📶📶📶Free trading signals:t.me/+EbXVM-CStnFmNjBk
إخلاء المسؤولية
لا يُقصد بالمعلومات والمنشورات أن تكون، أو تشكل، أي نصيحة مالية أو استثمارية أو تجارية أو أنواع أخرى من النصائح أو التوصيات المقدمة أو المعتمدة من TradingView. اقرأ المزيد في شروط الاستخدام.
💹💹💹Trading strategies and analysis: Gold, BTC, crude oil, foreign exchange, etc.
📶📶📶Free trading signals:t.me/+EbXVM-CStnFmNjBk
📶📶📶Free trading signals:t.me/+EbXVM-CStnFmNjBk
إخلاء المسؤولية
لا يُقصد بالمعلومات والمنشورات أن تكون، أو تشكل، أي نصيحة مالية أو استثمارية أو تجارية أو أنواع أخرى من النصائح أو التوصيات المقدمة أو المعتمدة من TradingView. اقرأ المزيد في شروط الاستخدام.