4-Hour Chart (Mid-Term View)
🔑Key Observations:
Uptrend Remains Intact:
Price is still above the 50 EMA, indicating continued bullish strength.
Key Resistance at $3,038:
A break above this level could trigger further upside momentum.
Support Levels:
$3,011 and $3,007: First support zone.
$2,983: Stronger support.

Potential Scenario:
Bullish Breakout: If price breaks above $3,038, the next target would be $3,048 and beyond.
🔸Failure to Breakout: If rejected at resistance, price might retrace to $3,011 or lower.
1-Hour Chart (Short-Term View)
🔑Key Observations:
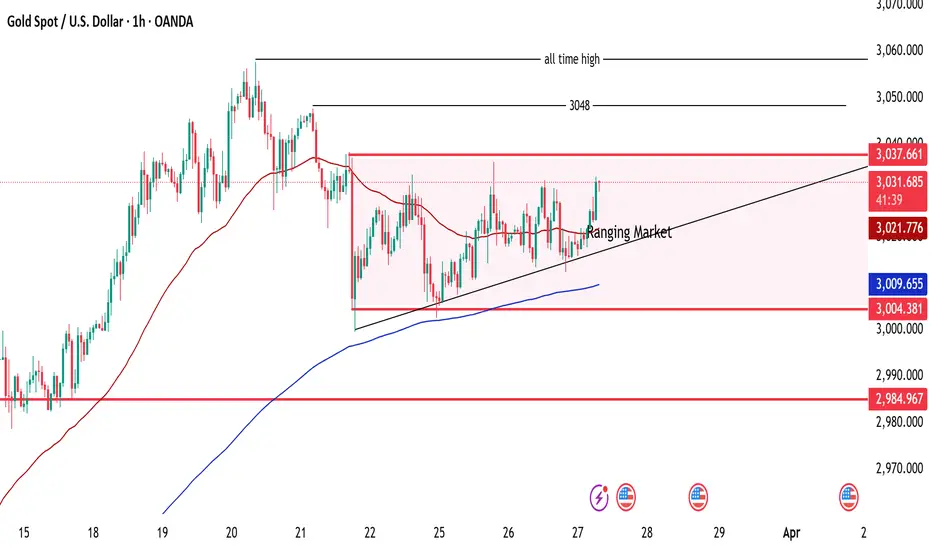
✅Ranging Market: Gold is consolidating within a horizontal range between $3,009 and $3,037, forming a sideways movement.
✅Ascending Trendline: The price is gradually increasing with a rising trendline acting as dynamic support.
🔸Key Resistance Levels:
$3,037-$3,048: Strong resistance zone.
All-Time High Above $3,057.5: Major resistance if the price breaks above $3,048.
✅Support Levels:
🔹$3,021 - 3,009: Key intraday support zone.
🔹$3,004 and $2,985: Stronger support zones below.
Moving Averages:
Price is above the 50 EMA (red line), indicating bullish strength.
The 200 EMA (blue line) is far below, showing overall long-term bullish sentiment.
💡Potential Trade Setup:
🔹Breakout Strategy: A breakout above $3,037-$3,048 could lead to new highs.
Range Trading: If the price remains within the range, traders can buy near support ($3,009) and sell near resistance ($3,037-$3,048).
15-Minute Chart (Intraday/Scalping View)
🔑Key Observations:
Recent Breakout Attempt: Price has tested the $3,030-$3,038 resistance zone.

200 EMA & 50 EMA Cross:
The red (50 EMA) is above the blue (200 EMA), signaling bullish sentiment.
Support Zone Identified (~$3,007-$3,022):
Price reacted strongly from this level, indicating strong buyer demand.
Trade Plan for Scalpers:
✅Long Entries: Look for pullbacks near $3,022 with stop-loss below $3,007.
✅Short Entries: If price rejects $3,038, look for short trades targeting $3,022 or lower.
🌟Final Conclusion & Trading Plan:
📌 Bullish Scenario:
🔹A break above $3,038 will confirm a bullish breakout.
🔹Potential target = $3,048, then all-time high $3,060+.
🔹Best strategy: Buy the breakout with proper stop-loss below $3,022.
📌 Bearish Scenario:
If price fails to break $3,038, expect a pullback to $3,011 - $3,007.
Possible short opportunities below $3,007 targeting $2,983.
📌 Neutral/Ranging Market:
Until price breaks $3,038 or drops below $3,007, expect sideways movement.
🔹 Recommended Trading Approach:
✅ Breakout traders: Watch for a confirmed break and retest above $3,038.
✅ Range traders: Buy near $3,009-$3,022 and sell near $3,038.
✅ Scalpers: Look for quick trades within the range of $3,007 - $3,037.
📉 Risk Management:
🔸 Keep a stop-loss below $3,007 if buying.
🔸 Keep a stop-loss above $3,038 if shorting.
👉 Always follow TP/SL to protect your capital and maximize profits!
Stay tuned for updates once the confirmations are in place!
Please support me with your likes and comments to motivate me to share more analysis with you and share your opinion about the possible trend of this chart with me !
📢Best Regards , Silver Wolf Traders Community
Disclaimer: This is for educational purposes only.
Always trade responsibly and manage your risk effectively
🔑Key Observations:
Uptrend Remains Intact:
Price is still above the 50 EMA, indicating continued bullish strength.
Key Resistance at $3,038:
A break above this level could trigger further upside momentum.
Support Levels:
$3,011 and $3,007: First support zone.
$2,983: Stronger support.
Potential Scenario:
Bullish Breakout: If price breaks above $3,038, the next target would be $3,048 and beyond.
🔸Failure to Breakout: If rejected at resistance, price might retrace to $3,011 or lower.
1-Hour Chart (Short-Term View)
🔑Key Observations:
✅Ranging Market: Gold is consolidating within a horizontal range between $3,009 and $3,037, forming a sideways movement.
✅Ascending Trendline: The price is gradually increasing with a rising trendline acting as dynamic support.
🔸Key Resistance Levels:
$3,037-$3,048: Strong resistance zone.
All-Time High Above $3,057.5: Major resistance if the price breaks above $3,048.
✅Support Levels:
🔹$3,021 - 3,009: Key intraday support zone.
🔹$3,004 and $2,985: Stronger support zones below.
Moving Averages:
Price is above the 50 EMA (red line), indicating bullish strength.
The 200 EMA (blue line) is far below, showing overall long-term bullish sentiment.
💡Potential Trade Setup:
🔹Breakout Strategy: A breakout above $3,037-$3,048 could lead to new highs.
Range Trading: If the price remains within the range, traders can buy near support ($3,009) and sell near resistance ($3,037-$3,048).
15-Minute Chart (Intraday/Scalping View)
🔑Key Observations:
Recent Breakout Attempt: Price has tested the $3,030-$3,038 resistance zone.
200 EMA & 50 EMA Cross:
The red (50 EMA) is above the blue (200 EMA), signaling bullish sentiment.
Support Zone Identified (~$3,007-$3,022):
Price reacted strongly from this level, indicating strong buyer demand.
Trade Plan for Scalpers:
✅Long Entries: Look for pullbacks near $3,022 with stop-loss below $3,007.
✅Short Entries: If price rejects $3,038, look for short trades targeting $3,022 or lower.
🌟Final Conclusion & Trading Plan:
📌 Bullish Scenario:
🔹A break above $3,038 will confirm a bullish breakout.
🔹Potential target = $3,048, then all-time high $3,060+.
🔹Best strategy: Buy the breakout with proper stop-loss below $3,022.
📌 Bearish Scenario:
If price fails to break $3,038, expect a pullback to $3,011 - $3,007.
Possible short opportunities below $3,007 targeting $2,983.
📌 Neutral/Ranging Market:
Until price breaks $3,038 or drops below $3,007, expect sideways movement.
🔹 Recommended Trading Approach:
✅ Breakout traders: Watch for a confirmed break and retest above $3,038.
✅ Range traders: Buy near $3,009-$3,022 and sell near $3,038.
✅ Scalpers: Look for quick trades within the range of $3,007 - $3,037.
📉 Risk Management:
🔸 Keep a stop-loss below $3,007 if buying.
🔸 Keep a stop-loss above $3,038 if shorting.
👉 Always follow TP/SL to protect your capital and maximize profits!
Stay tuned for updates once the confirmations are in place!
Please support me with your likes and comments to motivate me to share more analysis with you and share your opinion about the possible trend of this chart with me !
📢Best Regards , Silver Wolf Traders Community
Disclaimer: This is for educational purposes only.
Always trade responsibly and manage your risk effectively
إخلاء المسؤولية
لا يُقصد بالمعلومات والمنشورات أن تكون، أو تشكل، أي نصيحة مالية أو استثمارية أو تجارية أو أنواع أخرى من النصائح أو التوصيات المقدمة أو المعتمدة من TradingView. اقرأ المزيد في شروط الاستخدام.
إخلاء المسؤولية
لا يُقصد بالمعلومات والمنشورات أن تكون، أو تشكل، أي نصيحة مالية أو استثمارية أو تجارية أو أنواع أخرى من النصائح أو التوصيات المقدمة أو المعتمدة من TradingView. اقرأ المزيد في شروط الاستخدام.