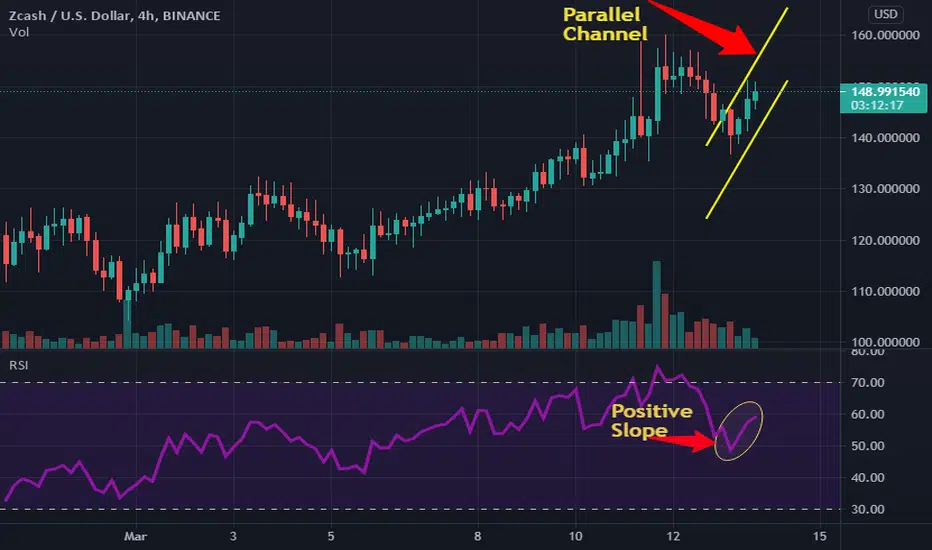
.The daily chart of ZEC hints at the start of a bullish move. On coming to the shorter time frame of 4 hours, the coin has formed a upward parallel channel. If the price breaks above 5% of the current position, it can see a rally upto $200 in upcoming trading sessions.ZEC price can also see a new low if it comes below the channel.
Kindly comment your thoughts below
Kindly comment your thoughts below
منشورات ذات صلة
إخلاء المسؤولية
لا يُقصد بالمعلومات والمنشورات أن تكون، أو تشكل، أي نصيحة مالية أو استثمارية أو تجارية أو أنواع أخرى من النصائح أو التوصيات المقدمة أو المعتمدة من TradingView. اقرأ المزيد في شروط الاستخدام.
منشورات ذات صلة
إخلاء المسؤولية
لا يُقصد بالمعلومات والمنشورات أن تكون، أو تشكل، أي نصيحة مالية أو استثمارية أو تجارية أو أنواع أخرى من النصائح أو التوصيات المقدمة أو المعتمدة من TradingView. اقرأ المزيد في شروط الاستخدام.