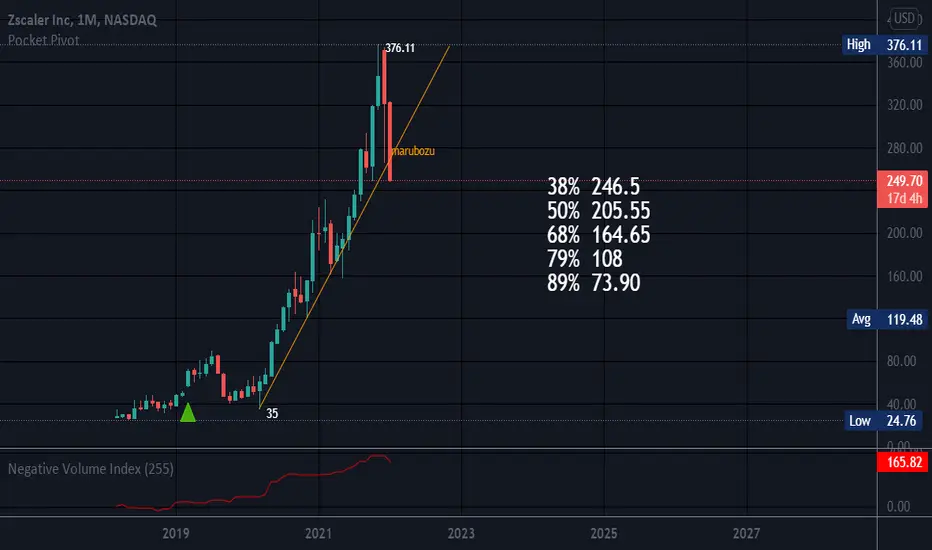
Perhaps but ZS went from 35 to 376.11 and is pulling back.
Short interest is 9.76%. Negative volume remains high. Oversold on MFI but not on RSI.
If this is indeed an arc, then on average they fall between 62% and 79%, or between the 0.618 and 0.786 fib levels, but can fall less or more than these levels. often a security will take a breather at the 50% mark. There are usually rallies up on the way down, but be safe as this gives buyers who are stuck up there and opportunity to sell, and they will once they figure out what is going on. Hence, bear flags and bearish patterns can form.
Parabolic Arcs are due to irrational exuberance and cause a very steep, unsustainable, rise and easiest to see on weekly or monthly time frames. It is difficult to trade an ARC on the way down as they can be volatile for some time to come. It is also possible that during the initial fall, some folks are still bullish and are astonished the security is falling.
No recommendation.
It can important to look in the rear view mirror.
ملاحظة
1/18 ZS received an upgrade.إخلاء المسؤولية
لا يُقصد بالمعلومات والمنشورات أن تكون، أو تشكل، أي نصيحة مالية أو استثمارية أو تجارية أو أنواع أخرى من النصائح أو التوصيات المقدمة أو المعتمدة من TradingView. اقرأ المزيد في شروط الاستخدام.
إخلاء المسؤولية
لا يُقصد بالمعلومات والمنشورات أن تكون، أو تشكل، أي نصيحة مالية أو استثمارية أو تجارية أو أنواع أخرى من النصائح أو التوصيات المقدمة أو المعتمدة من TradingView. اقرأ المزيد في شروط الاستخدام.