Ethereum ( $ETH) Whales Load Up as Price Holds Key SupportEthereum trades near $2,939 after a volatile month that flushed out weak hands and pulled price into long-term support. The market now watches whale behavior closely, because large wallets often position early before major trend shifts. A well-known Hyperliquid whale — famous for earning nearly $200M shorting the October crash — has now opened a $44.5M ETH long, gaining over $300K within the first hour. His timing historically matters, and many traders view this as a signal that smart money expects a reversal.
On-chain data strengthens this view. Wallets holding 10,000–100,000 ETH added 440,000 ETH in one week, aligning their cost basis with current prices. Meanwhile, mid-tier wallets continue to sell into strength. This creates a classic compression scenario: institutional-grade buyers accumulate while smaller players distribute. One group will break soon — and whales rarely fold first.
Institutional flows also support the bullish narrative. US spot-ETH ETFs recorded $96.67M in inflows, ending an eight-day outflow streak. The Coinbase Premium Index climbed from -0.12 to -0.02, showing improving US demand. With rate-cut expectations above 80%, the macro backdrop now leans favorable for risk assets like ETH.
Regulatory developments add another catalyst. US regulators approved banks to custody Ethereum, unlocking access for pension funds, insurers, and large financial institutions. Combined with the upcoming Fusaka Hard Fork on December 3, 2025, which boosts scalability and blob capacity, Ethereum enters a new phase of adoption.
Technically, ETH hovers at its long-term support zone. If $3,000 holds, targets sit at $3,450 and $3,800. A close below $2,900 opens a path toward $2,150–$2,200. For now, whale accumulation, ETF flows, and improving sentiment signal accumulation rather than fear.
Ethereum (Cryptocurrency)

ETHUSD H1 | Bullish Bounce Off Key SupportMomentum: Bullish
Price is currently above the ichimoku cloud.
Buy entry: 2,867.08
- Pullback support
- 61.8% Fib retracement
- 100% Fib projection
Stop Loss: 2,777.16
- Overlap support
Take Profit: 2,972.69
- Swing high resistance
High Risk Investment Warning
Stratos Markets Limited (tradu.com/uk ), Stratos Europe Ltd (tradu.com/eu ):
CFDs are complex instruments and come with a high risk of losing money rapidly due to leverage. 70% of retail investor accounts lose money when trading CFDs with this provider. You should consider whether you understand how CFDs work and whether you can afford to take the high risk of losing your money.
Stratos Global LLC (tradu.com/en ): Losses can exceed deposits.
Please be advised that the information presented on TradingView is provided to Tradu (‘Company’, ‘we’) by a third-party provider (‘TFA Global Pte Ltd’). Please be reminded that you are solely responsible for the trading decisions on your account. Any information and/or content is intended entirely for research, educational and informational purposes only and does not constitute investment or consultation advice or investment strategy. The information is not tailored to the investment needs of any specific person and therefore does not involve a consideration of any of the investment objectives, financial situation or needs of any viewer that may receive it. Past performance is not a reliable indicator of future results. Actual results may differ materially from those anticipated in forward-looking or past performance statements. We assume no liability as to the accuracy or completeness of any of the information and/or content provided herein and the Company cannot be held responsible for any omission, mistake nor for any loss or damage including without limitation to any loss of profit which may arise from reliance on any information supplied by TFA Global Pte Ltd.

DCRUSDT LongDecred is forming a strong bullish pattern. After a period of consolidation following a strong impulsive move, it is now beginning a new wave. The minimum target is to break and renew the current high at the 70 level.

LTCUSDT LongConsolidation on H4 Chart, now price is on the bottom of pattern. Bullish signal is clear, Risk Reward 1:5

$ETH - Under $1400 in 2026You may not believe this I don't either, but this is my Scenario number 1 right now.

Ethereum Faces Death Cross After 9 Months After $4 Billion SellEthereum is currently priced at $2,921, sitting just under the crucial $3,000 resistance level. Losing this psychological threshold triggered the wave of $4 billion in selling and reinforced bearish sentiment.
In the near term, ETH will likely consolidate under $3,000 and attempt to hold above support at $2,814 or $2,681. If market conditions worsen or investors continue to sell, Ethereum could break below $2,681 and slide toward $2,606 or lower.
If broader conditions stabilize, ETH could regain bullish momentum. A decisive reclaim of $3,000 would open the path toward $3,131 and potentially $3,287. This would helping Ethereum invalidate the bearish thesis and rebuild confidence among holders.

Ethereum Outlook: Downtrend Nearing Exhaustion?The crypto market continues to slide, with Ethereum struggling to regain footing. While the short-term trend remains bearish, we may be closer to the end of this decline than the start. Still, wide price swings are likely, and traders should remain cautious.
🔻 Key Breakdown
Ethereum has lost the critical $3,300–$3,400 support, which now flips to resistance. This zone had been a strong base, and its loss introduces technical headwinds that could limit near-term upside.
📉 Next Support to Watch
The $2,600–$2,800 range is the next major support. A test of this zone could offer clues about trend exhaustion or continuation.
🔮 2026 Outlook Still Bullish
Despite the short-term weakness, the macro view hasn’t changed. We expect Ethereum to revisit all-time highs by 2026, with the potential to test the $6,000 area.
📌 Stay focused on key levels and watch for signs of reversal before assuming a bottom is in.

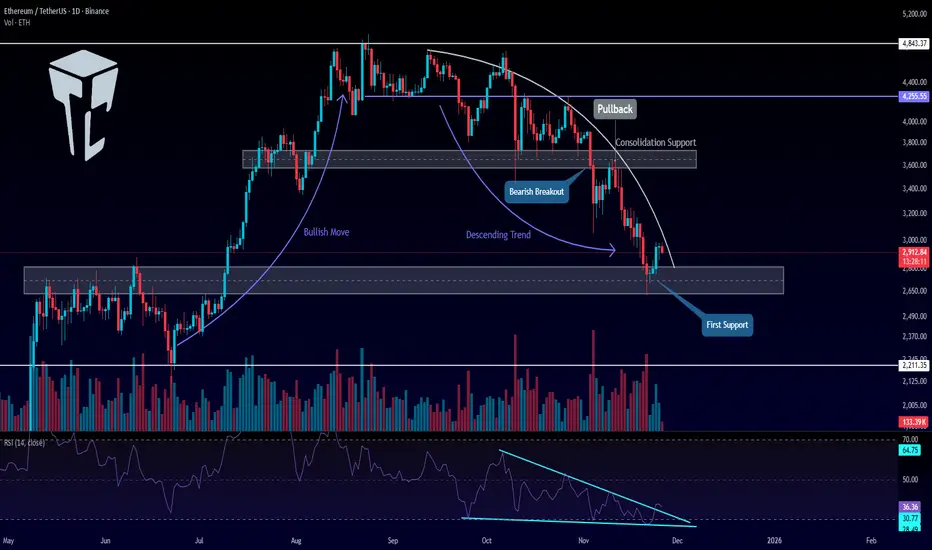
TradeCityPro | Ethereum Eyes Key Levels for Trend Reversal👋 Welcome to TradeCityPro!
Let’s dive into the Ethereum analysis, the queen of the market, ranked 2nd on CoinMarketCap with a $351 billion market cap, right after Bitcoin.
📅 Daily Timeframe
On the daily timeframe, after the upward movement Ethereum made, it reached the 4,843 resistance zone and then entered a consolidation phase.
✅ The bottom of this range was at 3,700, and the middle of the box was at 4,255, which the price reacted to.
🔔 After breaking the lower boundary of the box, the bullish trend Ethereum had came to an end, and a bearish trend with a curved trendline began.
⚖️ After a pullback to the 3,700 zone, a downward move took place, reaching the next support zone at 2,700, and now the price is reacting to the 2,700 zone.
💥 The RSI oscillator formed a descending triangle during this move, which contributed to the increasing bearish momentum in the market.
💡 Now, with the price reaching 2,700, the triangle has broken to the upside, and the bearish momentum has slowed down for now.
🎲 The confirmation of the new bullish momentum will come after breaking the curved trendline and forming a higher high and higher low above the 2,700 level.
📈 The main trigger for Ethereum's bullish trend will be stabilization above 3,700.
⚡️ If the 2,700 level breaks, the next support zone will be at 2,211.
💫 Personally, I’ll try to open a short position on Ethereum if the 2,700 level breaks.
🔼 For a long position, triggers can be found on lower timeframes, but for the main positions, we should wait for the price to form a higher high and higher low.
📝 Final Thoughts
Stay calm, trade wisely, and let's capture the market's best opportunities!
This analysis reflects our opinions and is not financial advice.
Share your thoughts in the comments, and don’t forget to share this analysis with your friends! ❤️
ETHUSD Technical (Bullish Plan) ...ETHUSD Price retraced back into the 2910 zone, which has been acting as a clean reaction point in previous structure. After the pullback, ETH is holding above the range low and showing signs of stabilizing, suggesting that buyers are defending this area. As long as price holds above 2910 on the 4H structure, the upside bias remains intact.
The first major objective sits around 3700, where previous supply and structural resistance align. If momentum continues and ETH clears that level without rejection, the next extension target is 4300, which aligns with the higher-timeframe resistance zone and the next liquidity pocket.
This setup remains valid as long as ETH doesn’t close strongly below the 2910 support, which would invalidate the bullish continuation idea and shift momentum back to the downside

Bullish bounce off?Ethereum (ETH/USD) has bounced off the pivot, which has been identified as an overlap support, and could rise to the pullback resistance.
Pivot: 2,868.29
1st Support: 2,781.04
1st Resistance: 3,049.57
Disclaimer:
The opinions given above constitute general market commentary and do not constitute the opinion or advice of IC Markets or any form of personal or investment advice.
Any opinions, news, research, analyses, prices, other information, or links to third-party sites contained on this website are provided on an "as-is" basis, are intended to be informative only, and are not advice, a recommendation, research, a record of our trading prices, an offer of, or solicitation for, a transaction in any financial instrument and thus should not be treated as such. The information provided does not involve any specific investment objectives, financial situation, or needs of any specific person who may receive it. Please be aware that past performance is not a reliable indicator of future performance and/or results. Past performance or forward-looking scenarios based upon the reasonable beliefs of the third-party provider are not a guarantee of future performance. Actual results may differ materially from those anticipated in forward-looking or past performance statements. IC Markets makes no representation or warranty and assumes no liability as to the accuracy or completeness of the information provided, nor any loss arising from any investment based on a recommendation, forecast, or any information supplied by any third party.

BTC Cup and Handle Still Not CompleteAs you can see the SPX broke out of the cup and handle and completed the measured move. It then corrected back down to the top of the handle and resumed its uptrend. This is what is coming for Bitcoin. Bitcoin has only half way completed the cup and handle. Measured move to around 300k before correcting back down to 70k and then back off to the races. Hold onto your hats. That would be the most epic move of all time a straight shot from here to 300k no pullback then slam back down to 70k and then back up to 500k. Could happen fast dont underestimate Bitcoin.
Just my opinion not financial advice.

Litecoin LTC/USD Buy The Fear Sell The EuphoriaI haven't made a Litecoin chart in a while. We've been sideways and uneventful, figured I would wait till something eventful happens. Well here it is folks , the moment before we actually move up everyone is selling except for a few smart hands. This fractal says it all in my opinion. fractals are usually very similar but not exact. Where we are now in price for Litecoin around 83 is really close to the bottom of this pullback. It washed out and cleaned up all the leverage, a very common occurrence in this market before large moves up. The move will be absolutely explosive and probably no meaningful pullback until we break the all time high. I see a pullback to retest the high before the next massive leg up.
Right now in my opinion is the worst place to sell. I know this "bear market" is not a real bear market because of how many people are saying it is. The whole world says its a bear market right now, every youtube grifter has pivoted to bear market recently with this drop, every news channel is saying it is. Thats why its not, most have sold already and now the price I believe will rebound so fast it'll shock everyone and the ones who sold will be in denial waiting for the "next low". When that low doesn't come and we break the highs they will all pile back in.
Everyone says oh this moving average, or this indicator, or this RSI. Look its all helpful stuff but its also all imaginary lines. Who says that we MUST be in a bear market because we broke a 200 day moving average. Who says because RSI is overbought we must go down. RSI has infinite different adjustments so whos to say that the 14 length is correct? These indicators will begin to fail over time as more and more people look at them. Right now there is more traders and wanna be traders in the world than ever before so if everyone is looking at the same thing all the time then most likely those will start to fail. Oh its happened every time before , I know , I know. Come on at the end of the day Bitcoin is still in its infancy. I dont buy the four year cycle, or seasonality crap, its foolish and betting your portfolio on those factors alone is a recipe for BROKE! I still stand by my previous long term predictions. Obviously its taking much longer than I expected but timing these things is nearly impossible on the long term time frame. While all the youtube grifters flip flop weekly I listen to the Billonaires and people who MAKE the markets. Saylor said three days ago the pullback is almost over and hes buying. Blackrocks Robbie Mitchnick says this is a good buying area and thats just a couple theres dozens of big wigs saying the same thing.
So to wrap this up I believe we are at the point of rocket ship. Look at economic factors, liquidity worldwide is expanding, stimulus is coming, tightening is ending, rates are coming down. Fiat currencies worldwide are about to go into hyperinflation and certain cryptos will reap the benefit of that. Bitcoin and Litecoin being the top gainers in this next phase of hyperinflation in my opinion. This is just my opinion and not financial advice. Thank you

ETHUSD H4 | Bullish ReversalMomentum: Bearish
The price is falling towards the buy entry, which aligns with the 38.2% Fibonacci retracement.
Buy entry: 2,872.04
Pullback support
38.2% Fibonacci retracement
Stop loss: 2,635.89
Pullback support
Take profit: 3,201.19
Overlap resistance
Slightly above the 50% Fibonacci retracement
High Risk Investment Warning
Stratos Markets Limited (tradu.com ), Stratos Europe Ltd (tradu.com ):
CFDs are complex instruments and come with a high risk of losing money rapidly due to leverage. 70% of retail investor accounts lose money when trading CFDs with this provider. You should consider whether you understand how CFDs work and whether you can afford to take the high risk of losing your money.
Stratos Global LLC (tradu.com ): Losses can exceed deposits.
Please be advised that the information presented on TradingView is provided to Tradu (‘Company’, ‘we’) by a third-party provider (‘TFA Global Pte Ltd’). Please be reminded that you are solely responsible for the trading decisions on your account. Any information and/or content is intended entirely for research, educational and informational purposes only and does not constitute investment or consultation advice or investment strategy. The information is not tailored to the investment needs of any specific person and therefore does not involve a consideration of any of the investment objectives, financial situation or needs of any viewer that may receive it. Past performance is not a reliable indicator of future results. Actual results may differ materially from those anticipated in forward-looking or past performance statements. We assume no liability as to the accuracy or completeness of any of the information and/or content provided herein and the Company cannot be held responsible for any omission, mistake nor for any loss or damage including without limitation to any loss of profit which may arise from reliance on any information supplied by TFA Global Pte Ltd.

ETHUSD 8H–EMA Trend Flip Retest, Will Supply Zone Reject Again?Ethereum is rallying into a major confluence zone following a confirmed bearish EMA trend flip, shown when the 50 EMA (yellow) crossed below the 100 EMA (purple). This crossover happened at the exact lower-high region inside the circled area, aligning with the break of structure that kicked off the broader downtrend.
Price is now rebounding from local lows and heading directly into the 3,200–3,350 supply zone — a region stacked with resistance: the descending trendline, the EMA cluster above, and the mid-range Fibonacci retracement levels. Historically, each retest of this zone has triggered strong sell pressure.
With Stoch RSI entering overbought conditions, ETH is reaching this resistance while momentum is cooling, increasing the probability of a bearish reaction. A rejection from the supply zone would put the next lower-low in play. A clean breakout — above both the EMAs and the trendline — would be the first early signal that buyers are attempting to reclaim structure.
Until that breakout occurs, the EMA cross keeps the bias firmly bearish.

Ethereum — Swing Low Locked In - 60% ahead!
ETH has established its swing low, and now it’s all about watching for the next impulse.
Against BTC, the chart is clean. ETH is actively reclaiming the pivotal zone, and as long as it holds above 0.03, this setup screams continuation.
Nothing overly complex here — structure is intact, momentum is stabilizing, and the path of least resistance is up.

ETHUSD oversold bounce capped at 2,988 resistanceThe ETHUSD pair continues to display a bearish outlook, in line with the prevailing downward trend. Recent price action suggests a corrective pullback, potentially setting up for another move lower if resistance holds.
Key Level: 2,988
This zone, previously a consolidation area, now acts as a significant resistance level.
A failed test and rejection at 2,988 would likely resume the bearish momentum.
Downside targets include:
2,620 – Initial support
2,496 – Intermediate support
2,266 – Longer-term support level
Bullish Scenario (breakout above 2,988):
A confirmed breakout and daily close above 2,988 would invalidate the bearish setup.
In that case, potential upside resistance levels are:
3,100 – First resistance
3,208 – Further upside target
Conclusion
ETHUSD remains under bearish pressure, with the 2,988 level acting as a key inflection point. As long as price remains below this level, the bias favours further downside. Traders should watch for price confirmation around that level to assess the next move.
This communication is for informational purposes only and should not be viewed as any form of recommendation as to a particular course of action or as investment advice. It is not intended as an offer or solicitation for the purchase or sale of any financial instrument or as an official confirmation of any transaction. Opinions, estimates and assumptions expressed herein are made as of the date of this communication and are subject to change without notice. This communication has been prepared based upon information, including market prices, data and other information, believed to be reliable; however, Trade Nation does not warrant its completeness or accuracy. All market prices and market data contained in or attached to this communication are indicative and subject to change without notice.

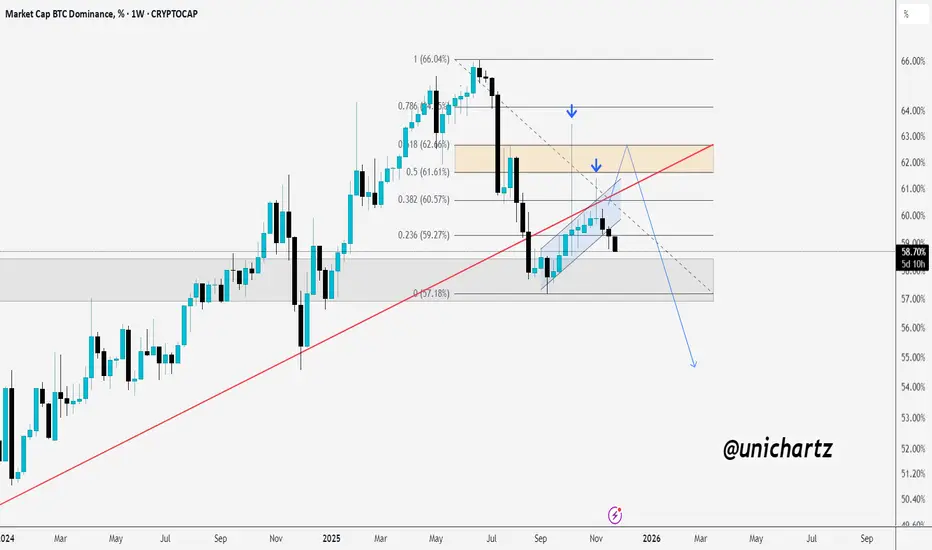
BTC.D Pullback Could Open Doors for AltsBTC dominance has broken below its long-term trendline and is currently holding near the 58–59% support zone, but momentum still appears weak.
The key resistance area sits between 61% and 62.5%, and any retest of this zone may struggle to break higher, especially with its alignment to major Fibonacci levels.
If BTC dominance fails to reclaim this zone with strength, the broader structure points toward continued downside, potentially targeting the 57% level and possibly lower if that support breaks.
A continued decline in dominance would generally favor altcoins, so it’s best to wait for clear confirmation before making any decisions.
DYOR, NFA
Please hit the like button if you like it, and share your views in the comments section.
ETH long-term TAEthereum is among the strongest crypto assets out of top 10 crypto market cap, the weekly uptrend is still holding up but has weaken a lot and currently entering bearish area which could drag Ethereum even lower.. There's current weekly support at $2700 which is holding up and if it's broken then it can go all the way to $2100 area. Mid-term is currently in heavy distribution but in general Ethereum looks stronger than Bitcoin on long-term at this moment.

EthereumETHUSD
- Bullish Channel as an corrective pattern in Short Time Frame
- Break of Structure
- RSI - Divergence
- Order Block
- S / R Level

Candlestick Patterns That Actually MatterTraders often approach candlestick patterns by memorizing long lists instead of understanding the behaviour behind them. Crypto moves aggressively, hunts liquidity, and punishes textbook interpretations unless they occur at meaningful locations. The goal is not pattern collection. The goal is to recognize the few formations that consistently reveal intention when aligned with structure, liquidity, and context.
Engulfing Candles, Displacement and Control
What it shows: a clear shift where one side fully absorbs the other. This is participation, not random volatility.
When it matters: after impulses, at support or resistance, during liquidity sweeps, or when confirming a trend shift.
Why it’s valuable: engulfing candles often provide the first structural evidence that control has changed hands.
Rejection Wicks, Liquidity Taken, Pressure Reverses
What it shows: price tapped a high or low, triggered stops, and immediately met stronger opposing orders. This is how sweeps appear on a single candle.
When it matters: at equal highs/lows, session extremes, failed breakouts, and major swing points.
Why it’s valuable: wicks expose trapped traders and reveal where true supply or demand sits. They are early indicators of shifting intent.
Inside and Outside Bars, Compression and Expansion
Inside Bar: compression, tighter ranges, and reduced volatility ahead of expansion.
Outside Bar: immediate expansion where one side overwhelms both directions.
When they matter: at key levels before breakouts, during corrective legs, at consolidation boundaries, and after liquidity events.
Why they’re valuable: inside bars show preparation; outside bars show decision.
Treat these signals as behavioural information. Their value increases when combined with higher timeframe structure, liquidity mapping, momentum, volume, and session context.
Bearish reversal off key resistance?Ethereum (ETH/USD) is rising towards the pivot and could reverse to the 1st support, which has been identified as a pullback support.
Pivot: 3,057.32
1st Support: 2,818.56
1st Resistance: 3,230.74
Disclaimer:
The opinions given above constitute general market commentary and do not constitute the opinion or advice of IC Markets or any form of personal or investment advice.
Any opinions, news, research, analyses, prices, other information, or links to third-party sites contained on this website are provided on an "as-is" basis, are intended to be informative only, and are not advice, a recommendation, research, a record of our trading prices, an offer of, or solicitation for, a transaction in any financial instrument and thus should not be treated as such. The information provided does not involve any specific investment objectives, financial situation, or needs of any specific person who may receive it. Please be aware that past performance is not a reliable indicator of future performance and/or results. Past performance or forward-looking scenarios based upon the reasonable beliefs of the third-party provider are not a guarantee of future performance. Actual results may differ materially from those anticipated in forward-looking or past performance statements. IC Markets makes no representation or warranty and assumes no liability as to the accuracy or completeness of the information provided, nor any loss arising from any investment based on a recommendation, forecast, or any information supplied by any third party.

Check if the price remains above 2887.66
Hello, fellow traders.
If you "Follow" me, you'll always receive the latest information quickly.
Have a great day.
-------------------------------------
(ETHUSDT 1D Chart)
The HA-Low indicator on the 1D chart is showing signs of forming at 2887.66.
Since the HA-Low indicator previously formed at 3472.96 and is showing signs of forming again, determining whether support at 2887.66 is crucial.
Furthermore, since the indicator is located near the M-Signal indicator on the 1M chart, we need to see if the price can maintain its upward momentum above the M-Signal indicator on the 1M chart.
In this sense, a rise above the previous HA-Low indicator level of 3472.96 is expected to trigger an uptrend.
Therefore, to ensure that the uptrend continues after breaking above a key point or range, we need to monitor whether the StochRSI, TC, and OBV indicators remain in an upward trend.
Since the OBV indicator has fallen below the EMA 3, it must rise above and remain above the EMA 3 level.
We need to confirm whether the price can rise above the M-Signal indicator on the 1M chart after passing through this volatility period around November 27th (November 26th-28th).
-
Thank you for reading.
We wish you successful trading.
--------------------------------------------------

Ethereum - A -40% crash comes first!🪄Ethereum ( CRYPTO:ETHUSD ) will soon reverse:
🔎Analysis summary:
Over the course of the past couple of months, Ethereum failed to create a new all time high. So eventually, we will see a bearish reversal and a major move lower in the future. The bullish triangle remains valid though, so it will be a major buying opportunity then.
📝Levels to watch:
$2,000 and $4,500
SwingTraderPhil
SwingTrading.Simplified. | Investing.Simplified. | #LONGTERMVISION
