Its5//@version=5
indicator("HMA Trend Signal", overlay=true)
// Parameters
length = input.int(21, title="HMA Length")
// Calculate the Hull Moving Average
wma1 = ta.wma(close, length)
wma2 = ta.wma(close, length / 2)
hma = ta.wma(2 * wma2 - wma1, math.round(math.sqrt(length)))
// Define conditions for buy and sell signals
buySignal = ta.crossover(close, hma)
sellSignal = ta.crossunder(close, hma)
// Plot the Hull Moving Average
plot(hma, color=color.blue, title="HMA")
// Plot signals
plotshape(buySignal, color=color.green, style=shape.labelup, location=location.belowbar, text="BUY", size=size.small)
plotshape(sellSignal, color=color.red, style=shape.labeldown, location=location.abovebar, text="SELL", size=size.small)
ابحث في الأفكار لـ "PLOT"

Its5//@version=5
indicator("HMA Trend Signal", overlay=true)
// Parameters
length = input.int(21, title="HMA Length")
// Calculate the Hull Moving Average
wma1 = ta.wma(close, length)
wma2 = ta.wma(close, length / 2)
hma = ta.wma(2 * wma2 - wma1, math.round(math.sqrt(length)))
// Define conditions for buy and sell signals
buySignal = ta.crossover(close, hma)
sellSignal = ta.crossunder(close, hma)
// Plot the Hull Moving Average
plot(hma, color=color.blue, title="HMA")
// Plot signals
plotshape(buySignal, color=color.green, style=shape.labelup, location=location.belowbar, text="BUY", size=size.small)
plotshape(sellSignal, color=color.red, style=shape.labeldown, location=location.abovebar, text="SELL", size=size.small)

كوفي النخيل //@version=5
indicator("NOVA ALGO", overlay = true)
// Get user input
nbuysell = input.bool(true, 'Buy/Sell Signal', inline = "BSNM",group='BUY/SELL SIGNAL')
nsensitivity = input.float(defval=2, title="-", inline = "BSNM", minval=1, maxval=20, group='BUY/SELL SIGNAL')
//candlecolor = input.bool(true, 'Buy/Sell Signal', inline = "BSNM",group='BUY/SELL SIGNAL')
// Trend Features
LongTrendAverage = input(true, 'Trend Cloud', group='TREND FEATURES')
TrendFollower = input(true, 'Trend Follower', group='TREND FEATURES')
ShowComulus = input(true, 'Comulus Cloud', group='TREND FEATURES')
CirrusCloud = input(true, 'Cirrus Cloud', group='TREND FEATURES')
enableReversal = input.bool(false, 'Dynamic TP 👁️ ', inline = 'overlayLine1', group = 'Settings')
// Risk Management
levels = input.bool(true, "Show TP/SL Levels" , group = "Risk Management" , inline = "MMDB2")
lvlLines = input.bool(true, "Show Lines ", inline="levels", group = "Risk Management")
linesStyle = input.string("SOLID", "", , inline="levels", group = "Risk Management")
lvlDistance = input.int(1, "Distance", 1, inline="levels2", group = "Risk Management")
lvlDecimals = input.int(2, " Decimals", 1, 8, inline="levels2", group = "Risk Management")
atrRisk = input.int(1, "Risk % ", 1, group = "Risk Management" , inline="levels3")
atrLen = input.int(14, " ATR Length", 1, group = "Risk Management" , inline="levels3")
decimals = lvlDecimals == 1 ? "#.#" : lvlDecimals == 2 ? "#.##" : lvlDecimals == 3 ? "#.###" : lvlDecimals == 4 ? "#.####" : lvlDecimals == 5 ? "#.#####" : lvlDecimals == 6 ? "#.######" : lvlDecimals == 7 ? "#.#######" : "#.########"
// Input settings
history_of_demand_to_keep = 20
show_zigzag = false
show_price_action_labels = false
showsr = input(true, title="Show Support & Resistance", group = 'Support & Resistance')
swing_length = input.int(defval=8, title="Sensitivity", group = 'Support & Resistance')
box_width = input.float(defval=4, title="Zone Width", group = 'Support & Resistance')
box_extend_option = input.string("Right", title="Extend Box", options= , group = 'Support & Resistance')
res = input.timeframe(title='Time Frame', defval='', group="Support & Resistance")
s1 = request.security(syminfo.tickerid, res, showsr, gaps=barmerge.gaps_on)
demand_color = input.color(color.rgb(0,188,212,70), title = 'Support & Resistance Color', group = 'Support & Resistance')
supply_color = input.color(color.rgb(178,40,51,70), title = '', group = 'Support & Resistance')
// Signal Generation
supertrend(_close, factor, atrLen) =>
atr = ta.atr(atrLen)
upperBand = _close + factor * atr
lowerBand = _close - factor * atr
prevLowerBand = nz(lowerBand )
prevUpperBand = nz(upperBand )
lowerBand := lowerBand > prevLowerBand or close < prevLowerBand ? lowerBand : prevLowerBand
upperBand := upperBand < prevUpperBand or close > prevUpperBand ? upperBand : prevUpperBand
int direction = na
float superTrend = na
prevSuperTrend = superTrend
if na(atr )
direction := 1
else if prevSuperTrend == prevUpperBand
direction := close > upperBand ? -1 : 1
else
direction := close < lowerBand ? 1 : -1
superTrend := direction == -1 ? lowerBand : upperBand
// SMA
ocAvg = math.avg(open, close)
sma4 = ta.sma(close, 8)
sma5 = ta.sma(close, 9)
sma9 = ta.sma(close, 13)
psar = ta.sar(0.02, 0.02, 0.2)
//*in Easy Words Super Trend + SMA = Signals
= supertrend(close, nsensitivity*2, 11)
source = close, period = 150
// Colors
green = #2BBC4D, green2 = #00DD00
red = #C51D0B, red2 = #DD0000
adxlen = 15
dilen = 15
dirmov(len) =>
up = ta.change(high)
down = -ta.change(low)
plusDM = na(up) ? na : up > down and up > 0 ? up : 0
minusDM = na(down) ? na : down > up and down > 0 ? down : 0
truerange = ta.rma(ta.tr, len)
plus = fixnan(100 * ta.rma(plusDM, len) / truerange)
minus = fixnan(100 * ta.rma(minusDM, len) / truerange)
adx(dilen, adxlen) =>
= dirmov(dilen)
sum = plus + minus
adx = 100 * ta.rma(math.abs(plus - minus) / (sum == 0 ? 1 : sum), adxlen)
adx
sig = adx(dilen, adxlen)
// range ADX threshold
sidewaysThreshold = input.int(title='ADX Sideways Threshold (10-30)', minval=2, defval=15)
// boolean expression to see if the ADX is below tehe sideways threshold
bool isSideways = sig < sidewaysThreshold
// adding the option to color the bars when in a trading range
useBarColor = true
bColor = isSideways ? color.new(#4b148d, 0) : na
barcolor(useBarColor ? bColor : na)
barcolor(close > supertrend ? #00e2ff : #fe0100)
// High Lows
y1 = low - (ta.atr(30) * 2), y1B = low - ta.atr(30)
y2 = high + (ta.atr(30) * 2), y2B = high + ta.atr(30)
bull = ta.crossover(close, supertrend) and close >= sma9
bear = ta.crossunder(close, supertrend) and close <= sma9
// Plots
windowsize = 100
offset = 0.9
sigma = 6
//plot(ta.alma(source, windowsize, offset, sigma))
windowsize2 = 310
offset2 = 0.85
sigma2 = 32
//plot(ta.alma(source, windowsize2, offset2, sigma2))
// Chart Features
smoothrng(x, t, m) =>
wper = t * 2 - 1
avrng = ta.ema(math.abs(x - x ), t)
smoothrng = ta.ema(avrng, wper) * m
smoothrng
smrng = smoothrng(close, 22, 6)
rngfilt(x, r) =>
rngfilt = x
rngfilt := x > nz(rngfilt ) ? x - r < nz(rngfilt ) ? nz(rngfilt ) : x - r : x + r > nz(rngfilt ) ? nz(rngfilt ) : x + r
rngfilt
filt = rngfilt(close, smrng)
// ▒▒▒▒▒▒▒▒▒▒▒▒▒▒▒▒▒▒▒▒▒▒▒▒▒▒▒▒▒▒▒▒▒▒▒▒▒▒▒▒▒▒▒▒▒▒▒▒▒▒▒▒▒▒▒▒▒▒▒▒▒▒▒▒▒▒▒▒▒▒▒▒▒▒▒▒▒▒▒▒▒▒▒▒▒▒▒▒▒▒▒▒▒▒▒▒▒▒▒▒▒▒▒▒▒▒▒▒▒▒▒▒▒▒
upward = 0.0
upward := filt > filt ? nz(upward ) + 1 : filt < filt ? 0 : nz(upward )
downward = 0.0
downward := filt < filt ? nz(downward ) + 1 : filt > filt ? 0 : nz(downward )
filtcolor = upward > 0 ? color.new(#00e2ff, 50) : downward > 0 ? color.new(#fe0100, 50) : color.new(#56328f, 0)
plot(TrendFollower ? filt : na, color=filtcolor, linewidth=1, title='Trend Tracer')
// Trend Cloud
tclength = 600
hullma = ta.wma(2*ta.wma(close, tclength/2)-ta.wma(close, tclength), math.floor(math.sqrt(tclength)))
plot(LongTrendAverage ? hullma : na, 'Trend Cloud', linewidth=4, color=close > hullma ? color.new(#00e2ff, 65) : color.new(#fe0100, 65))
// Comulus Cloud
candle = ta.alma(source, windowsize2, offset2, sigma2)
reach = ta.alma(source, windowsize, offset, sigma)
candlep = plot(ShowComulus ? candle : na, color=color.new(color.white, 100))
reachp = plot(ShowComulus ? reach : na, color=color.new(color.white, 100))
fill(reachp, candlep, color= candle > reach ? color.new(#fe0100, 85) : color.new(#00e2ff, 85))
// Chart Features
x1 = 22
x2 = 9
x3 = 15
x4 = 5
smoothrngX1(x, t, m) =>
wper = t * 2 - 1
avrng = ta.ema(math.abs(x - x ), t)
smoothrngX1 = ta.ema(avrng, wper) * m
smoothrngX1
smrngx1x = smoothrngX1(close, x1, x2)
smrngx1x2 = smoothrngX1(close, x3, x4)
rngfiltx1x1(x, r) =>
rngfiltx1x1 = x
rngfiltx1x1 := x > nz(rngfiltx1x1 ) ? x - r < nz(rngfiltx1x1 ) ? nz(rngfiltx1x1 ) : x - r : x + r > nz(rngfiltx1x1 ) ? nz(rngfiltx1x1 ) : x + r
rngfiltx1x1
filtx1 = rngfiltx1x1(close, smrngx1x)
filtx12 = rngfiltx1x1(close, smrngx1x2)
// ▒▒▒▒▒▒▒▒▒▒▒▒▒▒▒▒▒▒▒▒▒▒▒▒▒▒▒▒▒▒▒▒▒▒▒▒▒▒▒▒▒▒▒▒▒▒▒▒▒▒▒▒▒▒▒▒▒▒▒▒▒▒▒▒▒▒▒▒▒▒▒▒▒▒▒▒▒▒▒▒▒▒▒▒▒▒▒▒▒▒▒▒▒▒▒▒▒▒▒▒▒▒▒▒▒▒▒▒▒▒▒▒▒▒
upwardx1 = 0.0
upwardx1 := filtx1 > filtx1 ? nz(upwardx1 ) + 1 : filtx1 < filtx1 ? 0 : nz(upwardx1 )
downwardx1 = 0.0
downwardx1 := filtx1 < filtx1 ? nz(downwardx1 ) + 1 : filtx1 > filtx1 ? 0 : nz(downwardx1 )
filtx1colorx1 = color.rgb(0, 187, 212, 100)
xxx1 = plot(CirrusCloud ? filtx1 : na, color=filtx1colorx1, linewidth=1, title='Trend Tracer', editable = false)
xxx2 = plot(CirrusCloud ? filtx12 : na, color=filtx1colorx1, linewidth=1, title='Trend Tracer', editable = false)
fill(xxx1, xxx2, color= filtx1 > filtx12 ? color.new(#fe0100, 65) : color.new(#00e2ff, 65))
buy = bull and nbuysell ? label.new(bar_index, y1, sma4 >= sma5 ? "Strong Buy" : "Buy", xloc.bar_index, yloc.price, #00e2ff, label.style_label_up, color.white, size.normal) : na
sell = bear and nbuysell ? label.new(bar_index, y2, sma4 <= sma5 ? "Strong Sell" : "Sell", xloc.bar_index, yloc.price, #fe0100, label.style_label_down, color.white, size.normal) : na
// Other initializations
avg_volume = ta.sma(volume, 20)
very_weak_multiplier = 0.5
weak_multiplier = 1
strong_multiplier = 1.5
// Rejection handling
var int demandRejections = array.new_int(history_of_demand_to_keep, 0)
var int supplyRejections = array.new_int(history_of_demand_to_keep, 0)
var int demandCreationBars = array.new_int(history_of_demand_to_keep, na)
var int supplyCreationBars = array.new_int(history_of_demand_to_keep, na)
var box current_demand_box = array.new_box(history_of_demand_to_keep, na)
var box current_supply_box = array.new_box(history_of_demand_to_keep, na)
f_check_demand_rejections() =>
for i = 0 to history_of_demand_to_keep - 1
if not na(array.get(demandCreationBars, i))
if bar_index - array.get(demandCreationBars, i) > 15 and bar_index - array.get(demandCreationBars, i) % 15 == 0
label.new(bar_index, high, "Checking demand rejection", color=color.red)
dBox = array.get(current_demand_box, i)
if (na(dBox))
continue
withinBox = (high >= box.get_bottom(dBox) and high <= box.get_top(dBox)) or (close >= box.get_bottom(dBox) and close <= box.get_top(dBox))
bearishCandlesCount = math.sum(close < open ? 1 : 0, 15)
if withinBox and bearishCandlesCount >= 7
label.new(bar_index, low, "Bearish count > 7", color=color.blue)
array.set(demandRejections, i, array.get(demandRejections, i) + 1)
f_check_supply_rejections() =>
for i = 0 to history_of_demand_to_keep - 1
if not na(array.get(supplyCreationBars, i))
if bar_index - array.get(supplyCreationBars, i) > 15 and bar_index - array.get(supplyCreationBars, i) % 15 == 0
label.new(bar_index, low, "Checking supply rejection", color=color.red)
sBox = array.get(current_supply_box, i)
if (na(sBox))
continue
withinBox = (low <= box.get_top(sBox) and low >= box.get_bottom(sBox)) or (close <= box.get_top(sBox) and close >= box.get_bottom(sBox))
bullishCandlesCount = math.sum(close > open ? 1 : 0, 15)
if withinBox and bullishCandlesCount >= 7
label.new(bar_index, high, "Bullish count > 7", color=color.blue)
array.set(supplyRejections, i, array.get(supplyRejections, i) + 1)
f_array_add_pop(array, new_value_to_add) =>
array.unshift(array, new_value_to_add)
array.pop(array)
f_sh_sl_labels(array, swing_type) =>
var string label_text = na
if swing_type == 1
if array.get(array, 0) >= array.get(array, 1)
label_text := 'HH'
else
label_text := 'LH'
label.new(bar_index - swing_length, array.get(array,0), text = label_text, style=label.style_label_down, textcolor = color.white, color = color.new(color.white, 100), size = size.tiny)
else if swing_type == -1
if array.get(array, 0) >= array.get(array, 1)
label_text := 'HL'
else
label_text := 'LL'
label.new(bar_index - swing_length, array.get(array,0), text = label_text, style=label.style_label_up, textcolor = color.white, color = color.new(color.white, 100), size = size.tiny)
f_check_overlapping(new_poi, box_array, atr) =>
atr_threshold = atr * 2
okay_to_draw = true
for i = 0 to array.size(box_array) - 1
top = box.get_top(array.get(box_array, i))
bottom = box.get_bottom(array.get(box_array, i))
poi = (top + bottom) / 2
upper_boundary = poi + atr_threshold
lower_boundary = poi - atr_threshold
if new_poi >= lower_boundary and new_poi <= upper_boundary
okay_to_draw := false
break
else
okay_to_draw := true
okay_to_draw
f_supply_demand(value_array, bn_array, box_array, label_array, box_type, atr) =>
atr_buffer = atr * (box_width / 10)
box_left = array.get(bn_array, 0)
box_right = bar_index + 20
var float box_top = 0.00
var float box_bottom = 0.00
var float poi = 0.00
if box_type == 1
box_top := array.get(value_array, 0)
box_bottom := box_top - atr_buffer
poi := (box_top + box_bottom) / 2
else if box_type == -1
box_bottom := array.get(value_array, 0)
box_top := box_bottom + atr_buffer
poi := (box_top + box_bottom) / 2
okay_to_draw = f_check_overlapping(poi, box_array, atr)
swing_volume = volume
var string strength_text = ""
highest_volume_last_20 = ta.highest(volume, 20)
volume_percentage = math.round(swing_volume / highest_volume_last_20 * 100)
volume_percentage := math.min(volume_percentage, 100) // Cap the volume percentage to 100
var extend_option = extend.right
if box_extend_option == "Right"
extend_option := extend.right
else if box_extend_option == "Both"
extend_option := extend.both
if box_type == 1 and okay_to_draw and s1
box.delete( array.get(box_array, array.size(box_array) - 5) )
f_array_add_pop(box_array, box.new( left = box_left, top = box_top, right = box_right, bottom = box_bottom, border_color = color.rgb(242,54,69,50), border_width=1,
bgcolor = supply_color, extend = extend_option, text = strength_text, text_halign = text.align_right, text_valign = text.align_center, text_color = color.white, text_size = size.small, xloc = xloc.bar_index))
box.delete( array.get(label_array, array.size(label_array) - 5) )
f_array_add_pop(label_array, box.new( left = box_left, top = poi, right = box_right, bottom = poi, border_color = color.rgb(242,54,69,50), border_width=1, border_style=line.style_dotted,
bgcolor = color.new(color.black,100), extend = extend_option, text = '', text_halign = text.align_left, text_valign = text.align_center, text_color = color.white, text_size = size.small, xloc = xloc.bar_index))
else if box_type == -1 and okay_to_draw and s1
box.delete( array.get(box_array, array.size(box_array) - 5) )
f_array_add_pop(box_array, box.new( left = box_left, top = box_top, right = box_right, bottom = box_bottom, border_color = color.rgb(0,188,212,50), border_width=1,
bgcolor = demand_color, extend = extend_option, text = strength_text, text_halign = text.align_right, text_valign = text.align_center, text_color = color.white, text_size = size.small, xloc = xloc.bar_index))
box.delete( array.get(label_array, array.size(label_array) - 5) )
f_array_add_pop(label_array, box.new( left = box_left, top = poi, right = box_right, bottom = poi, border_color = color.rgb(0,188,212,50), border_width=1, border_style=line.style_dotted,
bgcolor = color.new(color.black,100), extend = extend_option, text = '', text_halign = text.align_left, text_valign = text.align_center, text_color = color.white, text_size = size.small, xloc = xloc.bar_index))
f_sd_to_bos(box_array, bos_array, label_array, zone_type) =>
if zone_type == 1
for i = 0 to array.size(box_array) - 1
level_to_break = box.get_top(array.get(box_array,i))
if close >= level_to_break
box.delete(array.get(box_array, i))
box.delete(array.get(label_array, i))
if zone_type == -1
for i = 0 to array.size(box_array) - 1
level_to_break = box.get_bottom(array.get(box_array,i))
if close <= level_to_break
box.delete(array.get(box_array, i))
box.delete(array.get(label_array, i))
f_extend_box_endpoint(box_array) =>
for i = 0 to array.size(box_array) - 1
box.set_right(array.get(box_array, i), bar_index + 30) // Extend only 20 bars
atr567 = ta.atr(50)
swing_high = ta.pivothigh(high, swing_length, swing_length)
swing_low = ta.pivotlow(low, swing_length, swing_length)
var swing_high_values = array.new_float(5,0.00)
var swing_low_values = array.new_float(5,0.00)
var swing_high_bns = array.new_int(5,0)
var swing_low_bns = array.new_int(5,0)
var current_supply_poi = array.new_box(history_of_demand_to_keep, na)
var current_demand_poi = array.new_box(history_of_demand_to_keep, na)
var supply_bos = array.new_box(5, na)
var demand_bos = array.new_box(5, na)
if not na(swing_high)
f_array_add_pop(swing_high_values, swing_high)
f_array_add_pop(swing_high_bns, bar_index )
if show_price_action_labels
f_sh_sl_labels(swing_high_values, 1)
f_supply_demand(swing_high_values, swing_high_bns, current_supply_box, current_supply_poi, 1, atr567)
else if not na(swing_low)
f_array_add_pop(swing_low_values, swing_low)
f_array_add_pop(swing_low_bns, bar_index )
if show_price_action_labels
f_sh_sl_labels(swing_low_values, -1)
f_supply_demand(swing_low_values, swing_low_bns, current_demand_box, current_demand_poi, -1, atr567)
f_sd_to_bos(current_supply_box, supply_bos, current_supply_poi, 1)
f_sd_to_bos(current_demand_box, demand_bos, current_demand_poi, -1)
f_extend_box_endpoint(current_supply_box)
f_extend_box_endpoint(current_demand_box)
// Inside the main execution, after the box is drawn, check for rejections
if not na(swing_low)
f_array_add_pop(swing_low_values, swing_low)
f_array_add_pop(swing_low_bns, bar_index )
if show_price_action_labels
f_sh_sl_labels(swing_low_values, -1)
f_supply_demand(swing_low_values, swing_low_bns, current_demand_box, current_demand_poi, -1, atr567)
f_check_demand_rejections()
if not na(swing_high)
f_array_add_pop(swing_high_values, swing_high)
f_array_add_pop(swing_high_bns, bar_index )
if show_price_action_labels
f_sh_sl_labels(swing_high_values, 1)
f_supply_demand(swing_high_values, swing_high_bns, current_supply_box, current_supply_poi, 1, atr567)
f_check_supply_rejections()
trigger2 = bull ? 1 : 0
countBull = ta.barssince(bull)
countBear = ta.barssince(bear)
trigger = nz(countBull, bar_index) < nz(countBear, bar_index) ? 1 : 0
atrBand = ta.atr(atrLen) * atrRisk
atrStop = trigger == 1 ? low - atrBand : high + atrBand
lastTrade(close) => ta.valuewhen(bull or bear , close, 0)
entry = levels ? label.new(time, close, "ENTRY " + str.tostring(lastTrade(close), decimals), xloc.bar_time, yloc.price, #00e2ff, label.style_label_left, color.white, size.normal) : na
label.set_x(entry, label.get_x(entry) + math.round(ta.change(time) * lvlDistance))
label.set_y(entry, lastTrade(close))
label.delete(entry )
stop_y = lastTrade(atrStop)
stop = levels ? label.new(time, close, "SL " + str.tostring(stop_y, decimals), xloc.bar_time, yloc.price, red2, label.style_label_left, color.white, size.normal) : na
label.set_x(stop, label.get_x(stop) + math.round(ta.change(time) * lvlDistance))
label.set_y(stop, stop_y)
label.delete(stop )
tp1Rl_y = (lastTrade(close)-lastTrade(atrStop))*1 + lastTrade(close)
tp1Rl = levels ? label.new(time, close, "1:1 TP " + str.tostring(tp1Rl_y, decimals), xloc.bar_time, yloc.price, green2, label.style_label_left, color.white, size.normal ) : na
label.set_x(tp1Rl, label.get_x(tp1Rl) + math.round(ta.change(time) * lvlDistance))
label.set_y(tp1Rl, tp1Rl_y)
label.delete(tp1Rl )
tp2RL_y = (lastTrade(close)-lastTrade(atrStop))*2 + lastTrade(close)
tp2RL = levels ? label.new(time, close, "2:1 TP " + str.tostring(tp2RL_y, decimals), xloc.bar_time, yloc.price, green2, label.style_label_left, color.white, size.normal) : na
label.set_x(tp2RL, label.get_x(tp2RL) + math.round(ta.change(time) * lvlDistance))
label.set_y(tp2RL, tp2RL_y)
label.delete(tp2RL )
tp3RL_y = (lastTrade(close)-lastTrade(atrStop))*3 + lastTrade(close)
tp3RL = levels ? label.new(time, close, "3:1 TP " + str.tostring(tp3RL_y, decimals), xloc.bar_time, yloc.price, green2, label.style_label_left, color.white, size.normal) : na
label.set_x(tp3RL, label.get_x(tp3RL) + math.round(ta.change(time) * lvlDistance))
label.set_y(tp3RL, tp3RL_y)
label.delete(tp3RL )
style = linesStyle == "SOLID" ? line.style_solid : linesStyle == "DASHED" ? line.style_dashed : line.style_dotted
lineEntry = levels and lvlLines ? line.new(bar_index - (trigger == 0 ? countBull : countBear), lastTrade(close), bar_index + lvlDistance, lastTrade(close), xloc.bar_index, extend.none, #00e2ff, style, 2) : na, line.delete(lineEntry )
lineStop = levels and lvlLines ? line.new(bar_index - (trigger == 0 ? countBull : countBear), stop_y, bar_index + lvlDistance, stop_y, xloc.bar_index, extend.none, #fe0100, style, 2) : na, line.delete(lineStop )
lineTp1Rl = levels and lvlLines ? line.new(bar_index - (trigger == 0 ? countBull : countBear), tp1Rl_y, bar_index + lvlDistance, tp1Rl_y, xloc.bar_index, extend.none, green2, style, 2) : na, line.delete(lineTp1Rl )
lineTp2RL = levels and lvlLines ? line.new(bar_index - (trigger == 0 ? countBull : countBear), tp2RL_y, bar_index + lvlDistance, tp2RL_y, xloc.bar_index, extend.none, green2, style, 2) : na, line.delete(lineTp2RL )
lineTp3RL = levels and lvlLines ? line.new(bar_index - (trigger == 0 ? countBull : countBear), tp3RL_y, bar_index + lvlDistance, tp3RL_y, xloc.bar_index, extend.none, green2, style, 2) : na, line.delete(lineTp3RL )
alertcondition(bull, title='Buy Signal', message = "BUY")
alertcondition(bear, title='Buy Signal', message = "BUY")
//import protradingart/pta_plot/6 as pp
//pp.peakprofit(bull, bear)

مؤشر خالدتمام 👌
إنت تقصد مؤشر (Indicator) يجمع بين الفوليوم (Volume) و مؤشر القوة النسبية (RSI) في إشارة واحدة.
فيه أكثر من طريقة لبنائه، وحعطيك فكرة عامة وبعض أمثلة:
---
1. فكرة مبسطة:
الـ RSI يقيس التشبع (Overbought/Oversold).
الـ Volume يقيس قوة الحركة (هل الحركة حقيقية أو ضعيفة).
إذا اجتمع تشبع + حجم تداول عالي ⇒ تكون الإشارة أقوى (لشراء أو بيع).
---
2. أمثلة على إشارات ممكنة:
شراء (Long): RSI أقل من 30 (تشبع بيعي) + حجم تداول أكبر من متوسطه.
بيع (Short): RSI أكبر من 70 (تشبع شرائي) + حجم تداول أكبر من متوسطه.
فلترة إشارات RSI: إذا RSI أعطى إشارة لكن الفوليوم ضعيف، نتجاهلها.
---
3. صيغة مؤشر مدمج (TradingView - Pine Script v5 مثال):
//@version=5
indicator("RSI + Volume Filter", overlay=false)
// الإعدادات
rsiLength = input.int(14, "RSI Length")
volLength = input.int(20, "Volume MA Length")
// حساب RSI و المتوسط
rsi = ta.rsi(close, rsiLength)
volMA = ta.sma(volume, volLength)
// إشارات
buySignal = (rsi < 30) and (volume > volMA)
sellSignal = (rsi > 70) and (volume > volMA)
// رسم RSI
plot(rsi, color=color.white, title="RSI")
hline(70, "Overbought", color=color.red)
hline(30, "Oversold", color=color.green)
// علامات الإشارات
plotshape(buySignal, title="Buy", location=location.bottom, color=color.green, style=shape.labelup, text="BUY")
plotshape(sellSignal, title="Sell", location=location.top, color=color.red, style=shape.labeldown, text="SELL")
---
نموذج//@version=5
indicator("متابعة سهم الغاز وتعليم ريت", overlay=true)
symbolGas = "TADAWUL:2080"
symbolTalim = "TADAWUL:4331"
// المتوسطات
ema9 = ta.ema(close, 9)
ema21 = ta.ema(close, 21)
volMA = ta.sma(volume, 20)
// إشارات تقاطع
bullishCross = ta.crossover(ema9, ema21)
rsi = ta.rsi(close, 14)
volSpike = volume > volMA
// إشارة دخول
entrySignal = bullishCross and rsi > 55 and volSpike
plotshape(entrySignal, location=location.belowbar, color=color.green, style=shape.labelup, text="دخول")
// عرض المتوسطات
plot(ema9, color=color.orange)
plot(ema21, color=color.blue)
ااا//@version=5
indicator("MFI Entry/Exit Signals", overlay=true, shorttitle="MFI Signals")
// إعدادات المؤشر
length = input.int(14, title="MFI Length")
overbought = input.int(80, title="Overbought Level")
oversold = input.int(20, title="Oversold Level")
// حساب مؤشر تدفق السيولة (MFI)
mfi = ta.mfi(close, high, low, volume, length)
// إشارات الشراء والبيع
longCondition = (mfi < oversold) and (ta.crossover(mfi, oversold))
shortCondition = (mfi > overbought) and (ta.crossunder(mfi, overbought))
// رسم الإشارات
plotshape(series=longCondition, location=location.belowbar, color=color.green, style=shape.labelup, text="BUY")
plotshape(series=shortCondition, location=location.abovebar, color=color.red, style=shape.labeldown, text="SELL")
// رسم الـ MFI على الشارت
hline(overbought, "Overbought", color=color.red, linewidth=1, linestyle=hline.style_dotted)
hline(oversold, "Oversold", color=color.green, linewidth=1, linestyle=hline.style_dotted)
plot(mfi, color=color.blue, linewidth=2)
Hhhhيمكنك استخدام الكود التالي لبرمجة مؤشر Demarker في "تريدينج فيو" باستخدام Pine Script. هذا الكود يقوم بإعطاء إشارة شراء عند إغلاق الشمعة أسفل مستوى 0.20 وإشارة بيع عند إغلاق الشمعة فوق مستوى 0.80.
```pinescript
//@version=5
indicator("Demarker Signal", overlay=false)
// إعدادات مؤشر Demarker
length = input(14, title="Length")
demarker = ta.demarker(length)
// مستويات الإشارات
buyLevel = 0.20
sellLevel = 0.80
// حساب إشارات الشراء والبيع
buySignal = ta.crossover(demarker, buyLevel)
sellSignal = ta.crossunder(demarker, sellLevel)
// رسم المؤشر
hline(buyLevel, "Buy Level", color=color.green)
hline(sellLevel, "Sell Level", color=color.red)
plot(demarker, title="Demarker", color=color.blue)
// إضافة إشارات الشراء والبيع على الرسم البياني
plotshape(buySignal, style=shape.labelup, location=location.belowbar, color=color.green, size=size.small, text="BUY")
plotshape(sellSignal, style=shape.labeldown, location=location.abovebar, color=color.red, size=size.small, text="SELL")
```
### كيفية استخدام الكود:
1. افتح "Pine Editor" في "تريدينج فيو".
2. انسخ الكود أعلاه والصقه في المحرر.
3. انقر على "Save" ثم "Add to Chart" لإضافة المؤشر إلى الرسم البياني.
سيظهر لك الآن مؤشر Demarker مع إشارات الشراء والبيع بناءً على المستويات المحددة. يمكنك تعديل طول المؤشر إذا كنت ترغب في ذلك.

gold//@version=5
strategy("استراتيجية فيبو ناتجي", overlay=true)
// حدد المتغيرات والإعدادات الأساسية
startBar = input(1, "البار الأول للحساب", minval=1)
endBar = input(10, "البار الأخير للحساب", minval=1)
fibLevels = input( , "مستويات الفيبوناتشي")
// حساب نقاط الفيبوناتشي
fibHigh = request.security(syminfo.tickerid, "D", request.high )
fibLow = request.security(syminfo.tickerid, "D", request.low )
fibRange = fibHigh - fibLow
fibPoints = fibLow + (fibLevels / 2) * fibRange
// رسم المستويات على الرسم البياني
for i = 0 to array.size(fibPoints) - 1
line.new(x1=startBar, y1=fibPoints , x2=endBar, y2=fibPoints , color=color.blue, width=1)
// تقاطع الأسعار مع مستويات الفيبوناتشي
for i = 0 to array.size(fibPoints) - 1
if ta.crossover(request.close, fibPoints )
strategy.entry("شراء", strategy.long)
if ta.crossunder(request.close, fibPoints )
strategy.close("شراء")
// إخراج النتائج
plot(request.close, "السعر", color=color.black, linewidth=1, style=plot.style_circles)

زمنبالطبع، إليك كود برمجي لاستراتيجية تداول تعتمد على MACD، وRSI، وBollinger Bands، والمتوسط المتحرك البسيط (SMA) لمدة 100 و200 فترة على فريم 15 دقيقة. سيتم تحديد هدف الربح والخسارة بـ20 نقطة.
```pinescript
//@version=5
strategy("MACD, RSI, Bollinger Bands with SMA 100 & 200", overlay=true)
// إعدادات المستخدم
macd_short_length = input(12, title="MACD Short Length")
macd_long_length = input(26, title="MACD Long Length")
macd_signal_smoothing = input(9, title="MACD Signal Smoothing")
rsi_length = input(14, title="RSI Length")
rsi_overbought = input(70, title="RSI Overbought Level")
rsi_oversold = input(30, title="RSI Oversold Level")
bb_length = input(20, title="Bollinger Bands Length")
bb_std_dev = input(2.0, title="Bollinger Bands Standard Deviation")
sma_100_length = input(100, title="SMA 100 Length")
sma_200_length = input(200, title="SMA 200 Length")
take_profit_points = input(20, title="Take Profit Points")
stop_loss_points = input(20, title="Stop Loss Points")
// حساب MACD
= ta.macd(close, macd_short_length, macd_long_length, macd_signal_smoothing)
// حساب RSI
rsi = ta.rsi(close, rsi_length)
// حساب Bollinger Bands
basis = ta.sma(close, bb_length)
dev = bb_std_dev * ta.stdev(close, bb_length)
upper_band = basis + dev
lower_band = basis - dev
// حساب المتوسط المتحرك البسيط
sma_100 = ta.sma(close, sma_100_length)
sma_200 = ta.sma(close, sma_200_length)
// إشارات الشراء والبيع
buy_signal = (crossover(macdLine, signalLine)) and (rsi < rsi_oversold) and (close < lower_band) and (close > sma_100) and (sma_100 > sma_200)
sell_signal = (crossunder(macdLine, signalLine)) and (rsi > rsi_overbought) and (close > upper_band) and (close < sma_100) and (sma_100 < sma_200)
// تنفيذ الصفقات بأوامر الشراء والبيع مع هدف الربح والخسارة
if (buy_signal)
strategy.entry("Buy", strategy.long, stop=close - stop_loss_points, limit=close + take_profit_points)
if (sell_signal)
strategy.entry("Sell", strategy.short, stop=close + stop_loss_points, limit=close - take_profit_points)
// رسم المؤشرات على الرسم البياني
plot(sma_100, title="SMA 100", color=color.blue)
plot(sma_200, title="SMA 200", color=color.red)
hline(rsi_overbought, "RSI Overbought Level", color=color.red)
hline(rsi_oversold, "RSI Oversold Level", color=color.green)
plot(upper_band, title="Upper Bollinger Band", color=color.orange)
plot(lower_band, title="Lower Bollinger Band", color=color.orange)
plot(macdLine, title="MACD Line", color=color.blue)
plot(signalLine, title="Signal Line", color=color.red)
```
### شرح الكود:
1. **المتغيرات المدخلة**: يمكنك ضبط معلمات MACD وRSI وBollinger Bands والمتوسط المتحرك البسيط وأهداف الربح والخسارة.
2. **حساب المؤشرات**:
- MACD.
- RSI.
- Bollinger Bands.
- SMA لفترة 100 و200.
3. **إشارات الشراء والبيع**:
- إشارة شراء عندما يتقاطع خط MACD فوق خط الإشارة، وRSI أقل من مستوى التشبع البيعي، والسعر أقل من الحد السفلي لـ Bollinger Bands، والسعر فوق SMA 100، وSMA 100 أعلى من SMA 200.
- إشارة بيع عندما يتقاطع خط MACD تحت خط الإشارة، وRSI أعلى من مستوى التشبع الشرائي، والسعر أعلى من الحد العلوي لـ Bollinger Bands، والسعر تحت SMA 100، وSMA 100 أقل من SMA 200.
4. **تنفيذ الصفقات**: يتم تنفيذ أمر شراء أو بيع مع تحديد هدف الربح والخسارة.
5. **رسم المؤشرات**: يتم رسم المؤشرات على الرسم البياني.
### تعليمات استخدام الكود:
1. انسخ الكود بالكامل.
2. افتح منصة TradingView.
3. انتقل إلى "Pine Editor" وألصق الكود.
4. احفظ الكود وطبقه على الرسم البياني.
يمكنك تعديل المعلمات في الجزء العلوي من الكود لضبط الاستراتيجية وفقًا لتفضيلاتك واحتياجاتك.

اماكن شراء مع الاهداف//@version=5
indicator("Buy/Sell Signals with TP1 & TP2", overlay=true)
// إعدادات المؤشر
length = input(14, title="Length")
src = close
// حساب متوسط الحركة والمتذبذب
ema_fast = ta.ema(src, length)
ema_slow = ta.ema(src, length * 2)
// إشارات الشراء والبيع
buySignal = ta.crossover(ema_fast, ema_slow)
sellSignal = ta.crossunder(ema_fast, ema_slow)
// تحديد أهداف الربح
tp1 = close + (close * 0.01) // 1% هدف
tp2 = close + (close * 0.02) // 2% هدف
// رسم الإشارات على الشارت
plotshape(series=buySignal, location=location.belowbar, color=color.green, style=shape.labelup, title="Buy Signal")
plotshape(series=sellSignal, location=location.abovebar, color=color.red, style=shape.labeldown, title="Sell Signal")
// عرض TP1 و TP2
label = "TP1: " + str.tostring(tp1) + "\nTP2: " + str.tostring(tp2)
label_pos = buySignal ? close + 10 : na
label_new = label_pos ? label : na
label1 = label_new != na ? label.new(x=time, y=label_pos, text=label, color=color.blue, textcolor=color.white, size=size.small) : na

عيدالله
//@version=5
indicator("استراتيجية تقاطع المتوسط المتحرك على فريم 5 دقائق", overlay=true)
// إعدادات المتوسطات المتحركة
shortLength = input(9, title="طول المتوسط المتحرك القصير")
longLength = input(21, title="طول المتوسط المتحرك الطويل")
// حساب المتوسطات المتحركة
shortSMA = ta.sma(close, shortLength)
longSMA = ta.sma(close, longLength)
// رسم المتوسطات المتحركة على الشارت
plot(shortSMA, color=color.blue, title="المتوسط المتحرك القصير")
plot(longSMA, color=color.red, title="المتوسط المتحرك الطويل")
// شروط الدخول والخروج
longCondition = ta.crossover(shortSMA, longSMA) // تقاطع صعودي (شراء)
shortCondition = ta.crossunder(shortSMA, longSMA) // تقاطع هبوطي (بيع)
// تنفيذ أوامر الدخول
if (longCondition)
strategy.entry("شراء", strategy.long)
if (shortCondition)
strategy.entry("بيع", strategy.short)
// إعدادات الخروج
strategy.close("شراء", when=shortCondition)
strategy.close("بيع", when=longCondition)

تحديث ذهبمبروك لكل الابطال متابعيني
حيث ذكرت في اخر تحديث شراء الذهب
من مناطق 3940 باستهداف 3980-4000-4025
الف مبروك
🔹 التحليل الفني (Technical Analysis)
السعر حاليًا عند 4,018 بعد صعود قوي داخل قناة صاعدة منتظمة، واخترق الحدّ العلوي للقناة بشكل واضح، ما يشير إلى قوة شرائية مفرطة (Overbought) قصيرة المدى.
• الحركة الحالية تُظهر تسارعًا في الزخم الصاعد.
• مناطق FVG المتكررة أسفل السعر تدل على وجود فجوات سعرية محتاجة لإعادة اختبار.
• السعر دخل في منطقة مقاومة هيكلية مهمة قرب 4,020 – 4,030، مما يجعل احتمالية التصحيح من هذه المنطقة مرتفعة.
⸻
🔹 التحليل الموجي (Elliott Waves)
• الموجة الحالية تمثل الموجة الخامسة الصاعدة ضمن خماسي رئيسي بدأ من 3,860.
• الموجة الثالثة انتهت عند 3,985 تقريبًا، ثم حدثت موجة رابعة تصحيحية نحو 3,940.
• الموجة الخامسة الحالية وصلت إلى منطقة التمدد بين 4,015 – 4,025 وهي مستوى مثالي لتصحيح قادم.
• بناءً على نسب فيبوناتشي، السعر يقترب من امتداد 161.8% للموجة 3 وهو عادةً مستوى نهاية الموجة الخامسة.
📉 السيناريو المتوقع موجيًا:
احتمال بداية تصحيح من منطقة 4,020 – 4,030 نحو 3,985 – 3,960 (موجة A تصحيحية).
⸻
🔹 التحليل الزمني (Time Cycles)
• الدورة الصاعدة بدأت قبل نحو 30 ساعة تداولية.
• المؤشرات الزمنية تشير إلى نضوج الدورة الحالية واحتمال دخول مرحلة توازن/تصحيح زمني خلال الساعات القادمة (من 8:00 إلى 13:00 بتوقيت العراق).
• الفترة الحرجة للانعكاس الزمني تقع قرب منتصف الجلسة الأوروبية.
⸻
🔹 التحليل الرقمي (Quantitative Analysis)
• نقطة التوازن الرقمية (Equilibrium) تقع عند 3,965.
• السعر يتحرك حالياً بنسبة +1.4% فوق المتوسط الرقمي، مما يعزز احتمال التصحيح الفني.
• الزخم الرقمي (Plot 15.0) في قمّة مرتفعة لم تُسجل منذ الصعود السابق، ما يعني تشبع شرائي رقمي واضح.
⸻
🔹 التحليل الأساسي (Fundamentals)
• السوق مدعوم بتراجع العائدات الأمريكية وتزايد توقعات خفض الفائدة خلال النصف الأول من 2026.
• لا توجد أخبار ثقيلة في الساعات القادمة، لذا الحركة الحالية فنية بحتة.
• المستثمرون يفضلون جني الأرباح بعد اختراق مستويات نفسية مثل 4,000.
⸻
🔹 البرايس أكشن (Price Action)
• الشموع الأخيرة قوية وطويلة الجسم (Momentum Candles) مع ذيول سفلية قصيرة، ما يؤكد السيطرة الكاملة للمشترين.
• مع ذلك، آخر شمعة بدأت تُظهر تباطؤًا في الزخم قرب الحد العلوي.
• ظهور شمعة انعكاسية أو ابتلاعية حمراء عند 4,020 – 4,030 سيكون دلالة واضحة على بداية تصحيح
�
الدعوم والمقاومات
دعم أول
3,985
منطقة ارتداد الموجة الرابعة السابقة
دعم ثانٍ
3,960 – 3,940
منطقة FVG + قاعدة قناة صاعدة
مقاومة أولى
4,020 – 4,030
قمة حالية واحتمال بداية التصحيح منها
مقاومة ثانية
4,045 – 4,050
امتداد فيبوناتشي محتمل في حال استمرار الزخم
دعم محوري رئيسي
3,900
توازن الحركة العامة الأسبوعية
🔹 النماذج الفنية (Chart Patterns)
• تشكّل نموذج إسفين صاعد (Rising Wedge) قرب القمة، وهو عادةً إشارة لانعكاس محتمل.
• كما يُحتمل رؤية نموذج شمعة “Shooting Star” في الساعات القادمة إذا فشل السعر في تجاوز 4,025.
⸻
🔹 النماذج الرقمية والهارمونيك (Harmonic Patterns)
• هناك احتمالية اكتمال نموذج Butterfly صاعد:
• النقطة D عند 4,020 – 4,030
• أهداف الهبوط: 3,985 – 3,960 – 3,935
• وقف النموذج فوق 4,045
⸻
🔹 مناطق الطلب والعرض
منطقة عرض (عرض قوية)
4,015 – 4,035
تداخل مع قمة القناة + نموذج Butterfly
منطقة طلب
3,960 – 3,940
دعم متراكب مع FVG نشطة
منطقة طلب ثانية
3,900 – 3,880
قاعدة الموجة الثالثة
�
نقطة التثبيت والمنطقة المحورية
• المنطقة المحورية (Pivot Zone): 3,980 – 3,990
• طالما السعر فوقها فالاتجاه العام يبقى صاعد، لكن أي كسر دونها بالإغلاق يعني بداية تصحيح فعلي.
🔹
التوصية النهائية
📈 الاتجاه العام: صاعد، لكن في منطقة تشبع شرائي واحتمال تصحيح قريب.
🎯 السيناريو المفضل:
انتظار إشارات ضعف أو شمعة انعكاس قرب 4,022 – 4,030 لبدء تصحيح نحو 3995-3,960.
🎯 في حال التصحيح: يمكن الشراء مجددًا من 3,960 – 3,940 بهدف 4,020.
📉 في حال اختراق 4,045: يستمر الاتجاه نحو 4,060 – 4,085 كامتداد للموجة الخامسة
ملاحظة هامة
نحن لانقدم لك نصائح مالية واستثمارية
بل نقدم لك محتوى علمي وتثقيفي
انت شخص الوحيد المسؤل عن ضغط زر الييع والشراء
المحلل
المهندس ايهاب
قناة سيد الذهب

تحليل بتكوين🔹 التحليل الفني (Technical Analysis)
البيتكوين يتحرك في اتجاه صاعد رئيسي لكنه دخل في مرحلة تصحيح عرضي/هابط مؤقت بعد بلوغ قمّة 126,800 – 127,000.
• السعر الحالي 124,570، متداولًا ضمن نطاق تذبذب ضيق.
• توجد مناطق FVG متعددة (Fair Value Gaps) تميل لتكوين مناطق طلب واضحة، ما يعني أن الحركة الحالية تصحيحية داخل الاتجاه الصاعد.
• الميل العام مازال إيجابي ما دام السعر فوق 122,000.
⸻
🔹 التحليل الموجي (Elliott Waves)
• الحركة من 116,000 إلى 127,000 تشكّل موجة ثالثة قوية من خماسي صاعد.
• السعر الآن داخل الموجة الرابعة التصحيحية (A-B-C).
• الموجة A: هبوط إلى 123,500
• الموجة B: ارتداد إلى 125,400
• الموجة C: يُتوقع أن تنتهي بين 122,800 – 123,200
• بعد اكتمال هذه الموجة الرابعة، تبدأ الموجة الخامسة الصاعدة بهدف مبدئي عند 128,000 – 130,000.
⸻
🔹 التحليل الزمني (Time Analysis)
• الدورة الصاعدة السابقة استمرت حوالي 36 ساعة تداول فعّالة.
• الموجة التصحيحية الحالية دخلت الساعة 18 تقريباً، ما يشير إلى أن الارتداد الصاعد قد يبدأ خلال 6–10 ساعات القادمة.
• الفترة الزمنية الحرجة المتوقعة لانعكاس الاتجاه: بين الساعة 21:00 الليلة وحتى فجر الغد بتوقيت العراق (+3).
⸻
🔹 التحليل الرقمي (Quantitative Levels)
• نقطة التوازن الرقمية (Midpoint) عند 124,000.
• السعر قريب منها، ما يعني أن السوق في مرحلة تجميع وليس تصريف.
• المؤشر الرقمي (Plot -6.29) يُظهر انخفاض الزخم الشرائي ولكن دون كسر منطقة السيولة الحرجة.
⸻
🔹 التحليل الأساسي (Fundamentals)
• لا توجد أخبار مباشرة على البيتكوين اليوم، لكن تحركات الدولار والمؤشرات الأمريكية تضيف بعض الضغط.
• السوق يترقب بيانات أمريكية خلال الساعات القادمة، ما قد يُسبب ذبذبة قصيرة قبل استئناف الاتجاه.
• المعنويات العامة في السوق ما زالت صاعدة بعد استقرار الفائدة وتزايد تدفق المؤسسات.
⸻
🔹 البرايس أكشن (Price Action)
• الشموع الأخيرة تُظهر قمم هابطة وذيول علوية طويلة تدل على تصحيح عرضي داخل نطاق.
• شمعة الارتداد من 124,200 قوية نسبيًا وتُظهر دخول سيولة شرائية مبكرة.
• أي إغلاق شمعة ساعة فوق 125,000 سيكون إشارة مؤكدة لبدء الموجة الخامسة.
⸻
🔹 الدعوم والمقاومات
دعم مهم
122,800 – 123,200
نهاية محتملة للموجة الرابعة + FVG غير مغلق
دعم ثانوي
124,000
نقطة توازن رقمية
مقاومة أولى
125,400
قمة الموجة B التصحيحية
مقاومة ثانية
126,800 – 127,000
قمّة رئيسية سابقة
مقاومة نهائية
128,500 – 130,000
هدف الموجة الخامسة المحتمل
🔹 النماذج الفنية (Chart Patterns)
• السعر حالياً يُكوّن نموذج راية (Bullish Flag) على فريم الساعة.
• الكسر الصاعد فوق 125,400 يُفعل النموذج بهدف فني يصل إلى 127,800 – 128,200.
⸻
🔹 النماذج الرقمية والهارمونيك (Harmonic Patterns)
• تتكوّن ملامح نموذج Gartley صاعد قيد الاكتمال:
• النقطة D المحتملة عند 122,800 – 123,000
• الأهداف: 125,800 – 127,800 – 129,500
• وقف الخسارة أسفل 122,000
⸻
🔹 مناطق الطلب والعرض
منطقة طلب قوية
122,800 – 123,400
FVG + دعم هيكلي
منطقة عرض
126,600 – 127,000
قمم سابقة وتشبع شراء
�
نقاط التثبيت والمنطقة المحورية
• المنطقة المحورية (Pivot Zone): 124,000 – 124,300
• نقطة التثبيت الأسبوعية: 122,800
الثبات فوق المحور يبقي الاتجاه صاعدًا
كسره للأسفل يعني تصحيح أعمق قبل الارتداد
🔹
التوصية النهائية
📈 الاتجاه العام: صاعد (ضمن تصحيح مؤقت)
🎯 منطقة الشراء المثالية: 122,800 – 123,200
🎯 الأهداف: 125,800 – 127,800 – 129,500
🛑 وقف الخسارة: إغلاق ساعة تحت 122,000
📉 في حال الكسر دون 122,000: يتحول الاتجاه إلى هابط نحو
19000
ملاحظة هامة
نحن لانقدم لك نصائح مالية واستثمارية
بل نقدم لك محتوى علمي وتثقيفي
انت شخص الوحيد المسؤل عن ضغط زر الييع والشراء
المحلل
المهندس ايهاب
قناة سيد الذهب

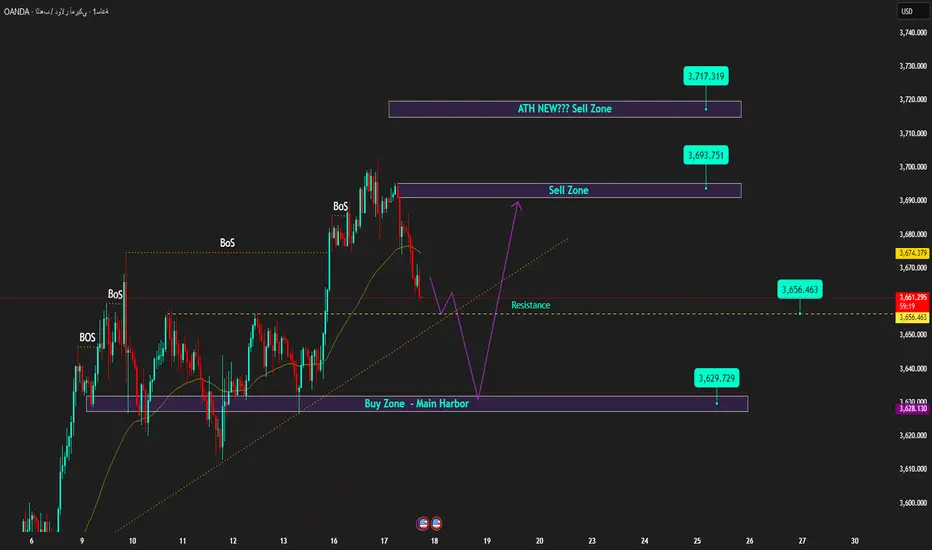
الفيدرالي قبل ساعة الحسم | شراء عند الدعم وبيع عند المقاومةXAU/USD – 17/09 | Captain Vincent ⚓
🔎 Captain’s Log – السياق الإخباري
18/09، الساعة 01:00 (بتوقيت أمريكا): الفيدرالي يعلن قرار الفائدة + Dot Plot → لتوجيه السياسة للاجتماعات القادمة.
01:30: كلمة باول – الحدث الأبرز الذي ينتظره السوق.
إجماع السوق: الفيدرالي شبه مؤكد سيخفض 25bps. ومع ذلك، يظل سيناريو 50bps قائماً → وإذا حدث سيكون “دفعة قوية” للذهب.
خلال جلسة آسيا – أوروبا، تعرض الذهب لعمليات جني أرباح مبكرة، فتراجع سريعاً إلى 3677 – 3675، مما يعكس حذر السوق قبل إعلان الفيدرالي.
⏩ Captain’s Summary: الذهب في مرحلة تصحيح تقني قبل إعلان الفيدرالي. الاتجاه المتوسط الأجل ما زال صاعداً (bullish)، لكن يلزم الصبر لانتظار ارتداد يمنح فرص شراء أفضل.
📈 Captain’s Chart – التحليل الفني
كاسر العاصفة (المقاومة / منطقة البيع):
OB قريب: 3693 – 3695 (سكالب قصير المدى).
ATH Zone: 3717 – 3720 (مقاومة قوية، محتمل ظهور ضغط بيع كبير).
الميناء الذهبي (الدعم / منطقة الشراء):
Shallow Dock: 3656 – 3657 (قصير المدى).
Main Harbor: 3629 – 3630 (تلاقي ترندلاين + BoS سابق).
هيكل السعر:
سلسلة من BoS تؤكد الاتجاه الصاعد.
السعر يتراجع نحو الدعم، مع احتمالية قوية للارتداد لاختبار 3693 – 3717.
إذا اخترق 3720 → سيثبت الذهب قمة تاريخية جديدة.
🎯 Captain’s Map – خطط التداول
✅ شراء (الأولوية الرئيسية)
منطقة الشراء 1
Entry: 3656 – 3657 | SL: 3648 | TP: 3675 – 3693 – 3717
منطقة الشراء 2
Entry: 3629 – 3630 | SL: 3618 | TP: 3656 – 3690 – 3717
⚡ بيع (فقط عند المقاومة)
Sell Zone OB
Entry: 3693 – 3695 | SL: 3705 | TP: 3675 – 3662
Sell Zone ATH
Entry: 3717 – 3720 | SL: 3727 | TP: 3706 – 3690 – 3675
Captain’s Note ⚓
“قبل ساعة الحسم للفيدرالي، دفعت أمواج جني الأرباح سفينة الذهب نحو Golden Harbor 🏝️ (3656 – 3629) . لكن التيار الرئيسي ما زال شمالياً، والاتجاه bullish لم يتغير. Storm Breaker 🌊 (3693 – 3720) هو الموجة العالية، مناسبة فقط لرحلات Quick Boarding 🚤 القصيرة. على الطاقم أن يصبر للارتداد – فقد تكون رياح الفيدرالي القوة التي تدفع الذهب لتجاوز قمة جديدة.”
الذهب 1H – أسبوع الفيدرالي: مسح السيولة قبل FOMCيتحرك الذهب على إطار الساعة حول 3,643 بعد سلسلة من إشارات ChoCH/BOS. تتراكم السيولة فوق منطقة الشراء داخل اليوم 3,658–3,656 وأعلى عند 3,676–3,678، بينما توجد سيولة الخصم قرب 3,615–3,613. مع تسعير السوق لاحتمال خفض الفائدة هذا الأسبوع وترقّب مخطط النقاط (dot-plot)، يُتوقَّع حدوث اندفاعات مُهندَسة إلى مناطق الـPremium تليها عودة للمتوسط قبل أي حركة مستدامة.
________________________________________
📌 البنية الرئيسية ومناطق السيولة (1H):
• 🔴 منطقة بيع 3,676 – 3,678 (SL 3,683): مقاومة Premium لسيناريو مسح/رفض مُهندَس بأهداف 3,665 → 3,655 → 3,645.
• 🟢 منطقة شراء 3,658 – 3,656 (SL 3,651): طلب داخلي ضمن تماسكٍ سابق بأهداف 3,665 → 3,670 → 3,675+.
• 🟢 دعم شراء 3,615 – 3,613 (SL 3,610): طلب خصم عند قاعدة البنية بأهداف 3,630 → 3,645 → 3,655+.
________________________________________
📊 أفكار التداول (حسب السيناريو):
🔺 سيناريو شراء – استعادة داخل اليوم (3,658–3,656)
• الدخول: 3,658 – 3,656
• وقف الخسارة: 3,651
• أهداف جني الربح:
TP1: 3,665
TP2: 3,670
TP3: 3,675+
👉 ابحث عن مسحٍ للسيولة داخل المنطقة وإغلاق H1 مجدّدًا فوق 3,656 لتأكيد استمرارية تدفّق الأوامر.
🔺 سيناريو شراء – مسح خصمي عميق (3,615–3,613)
• الدخول: 3,615 – 3,613
• وقف الخسارة: 3,610
• أهداف جني الربح:
TP1: 3,630
TP2: 3,645
TP3: 3,655+
👉 نسبة عائد/مخاطرة مرتفعة إذا جرى سحب السيولة إلى منطقة الطلب المحمية قبل جلسة نيويورك.
🔻 سيناريو بيع – مسح Premium إلى المقاومة (3,676–3,678)
• الدخول: 3,676 – 3,678
• وقف الخسارة: 3,683
• أهداف جني الربح:
TP1: 3,665
TP2: 3,655
TP3: 3,645
👉 متوقع تشغيل وقف خسائر فوق القمم الأخيرة والدخول إلى الـPremium؛ يُلغى السيناريو عند إغلاق H1 قوي فوق 3,683.
________________________________________
🔑 ملاحظة استراتيجية
في أسبوع الفيدرالي غالبًا ما تُدار السيولة على جانبي السوق. ميل اليوم: شراءٌ عند مناطق الخصم 3,658–3,656 و3,615–3,613، وبيعٌ تلاشيًا عند 3,676–3,678. خفّض حجم العقود، وانتظر تأكيد البنية، وتجنّب الاحتفاظ خلال أي عناوين مفاجئة تخصّ الفيدرالي أو اندفاعات الدولار.

تحليل أسعار الذهب قبل اجتماع اللجنة الفيدرالية للسوق المفتوحة فيالتحليل الأساسي
في اليوم الذي أعلن فيه بنك الاحتياطي الفيدرالي عن نتائجه، واصلت الأسواق تسعير فرصة بنسبة 65٪ لخفض سعر الفائدة بمقدار 50 نقطة أساس، حسبما أظهرت أداة FedWatch من مجموعة CME، مما أدى إلى إحياء اهتمام البيع حول العملة الأمريكية (USD). كما تحولت عوائد سندات الخزانة إلى موقف دفاعي وسط حذر السوق.
لذا. تحاول أسعار الذهب استعادة أعلى مستوياتها على الإطلاق قبل علامة 2600 دولار، حيث تتجه الأنظار إلى حكم بنك الاحتياطي الفيدرالي والمؤتمر الصحفي لرئيس مجلس الإدارة جيروم باول ومخطط Dot Plot، وكلها ستساعد في قياس إجراءات السياسة المستقبلية للبنك المركزي الأمريكي.
إذا قام بنك الاحتياطي الفيدرالي بتخفيض سعر الفائدة بمقدار 25 نقطة أساس في وقت لاحق من هذا الأربعاء، فقد يؤدي ذلك إلى ارتفاع مفاجئ في الدولار الأمريكي. ومع ذلك، فإن رد الفعل الفوري على إعلانات بنك الاحتياطي الفيدرالي قد تطغى عليه الآثار المترتبة على توقعات بنك الاحتياطي الفيدرالي وكلمات باول. ولذلك، لا تزال أسعار الذهب عرضة لتقلبات قوية خلال حدث بنك الاحتياطي الفيدرالي.
على العكس من ذلك، إذا اعترف بنك الاحتياطي الفيدرالي بالمخاطر المحتملة للتضخم وحافظ على لهجة حذرة، فإن هذا قد يعيد الصقور إلى اللعبة، مما يؤثر سلباً على سعر الذهب الذي لا يدر فائدة.
التحليل الفني
يكسر الذهب النطاق السعري الهابط ويقترب من مستوى المقاومة حول 2575. إذا لم نتمكن من كسر هذه المنطقة قبل الجلسة الأمريكية، فيمكننا البيع والدفع نحو 255x و2545 عندما تعلن اللجنة الفيدرالية للسوق المفتوحة عن الشراء مرة أخرى والحفاظ على ما يصل إلى 262x . في حالة كسر منطقة 2575، لن نبيع وننتظر إغلاق الشمعة فوق 258x ونشتري عند إعادة اختبار منطقة 2575 ونستمر حتى لا تكسر اللجنة الفيدرالية للسوق المفتوحة ATH الجديد ثم سنخرج من الأمر.
اختراق الحد العلوي: 2582 - 2591 - 2603
المقاومة العلوية: 2581 - 2590 - 2600 - 2605 - 2615 - 2626 - 2645
اختراق الحدود السفلية: 2570 - 2563 - 2550 - 2538
الدعم: 2572 - 2564 - 2552 - 2545 - 2539 - 2525 - 2516
لاحظ منطقة الاتجاه حول 2580 أعلاه.
نطاق سعر البيع 2603-2605. ستوبلوس 2609
كانه شراء 2564 - 2562. ستوبلوس 2558
كانه شراء 2545 - 2547. ستوبلوس 2541
