PROTECTED SOURCE SCRIPT
تم تحديثه Order Flow Analysis
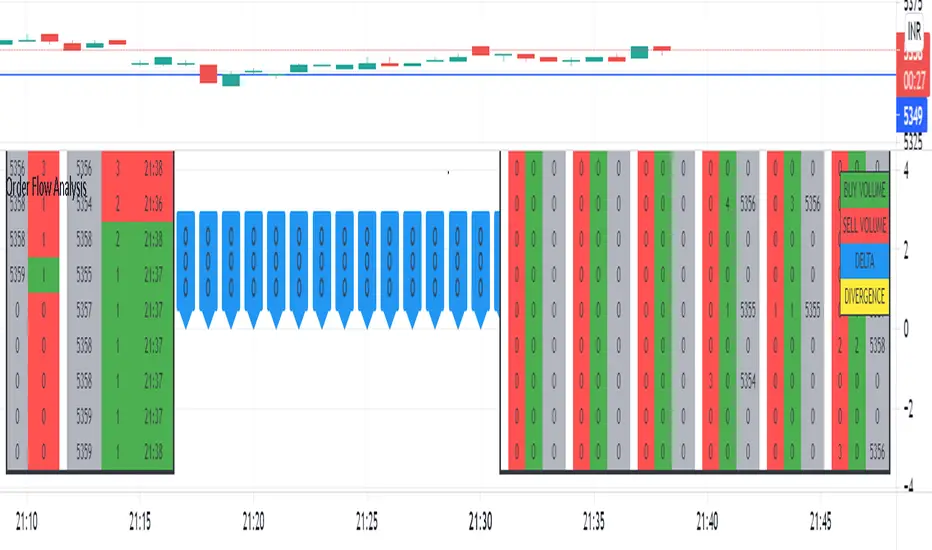
The script plots the order flow clusters for the last six candles in the middle right.
The cluster contains buy volume, sell volume and the price range of the volume.
It calculates uptick volume as buy volume and down tick volume as sell volume and calculates the delta(shown in labels). Recent ATR is considered to determine each cell price range in the cluster.
At the left side, the top volume ticks and the live ticks are displayed.
Please note this works only during market trading hours.
Do not refresh the browser tab and do not change the timeframe, which will cause a reset of numbers.
ملاحظات الأخبار
Delta divergences are shown in labels with yellow color. Labels are present at 0 price.Please scroll and zoom to get the delta labels.Minor enhancements and bug fixes.
ملاحظات الأخبار
Minor enhancements.ملاحظات الأخبار
converted to V5The delta bars now overlay on the chart ( can also be separated into new pane below)
Delta bars size, font size, color and number of required bars can be changed
minor improvements and fixes
Delta labels will be aligned automatically below day's low with an offset that can be changed.
نص برمجي محمي
تم نشر هذا النص البرمجي كمصدر مغلق. ومع ذلك، يمكنك استخدامه بحرية ودون أي قيود - تعرف على المزيد هنا.
إخلاء المسؤولية
لا يُقصد بالمعلومات والمنشورات أن تكون، أو تشكل، أي نصيحة مالية أو استثمارية أو تجارية أو أنواع أخرى من النصائح أو التوصيات المقدمة أو المعتمدة من TradingView. اقرأ المزيد في شروط الاستخدام.