OPEN-SOURCE SCRIPT
Price Touches 50-Day MA and Fails to Cross
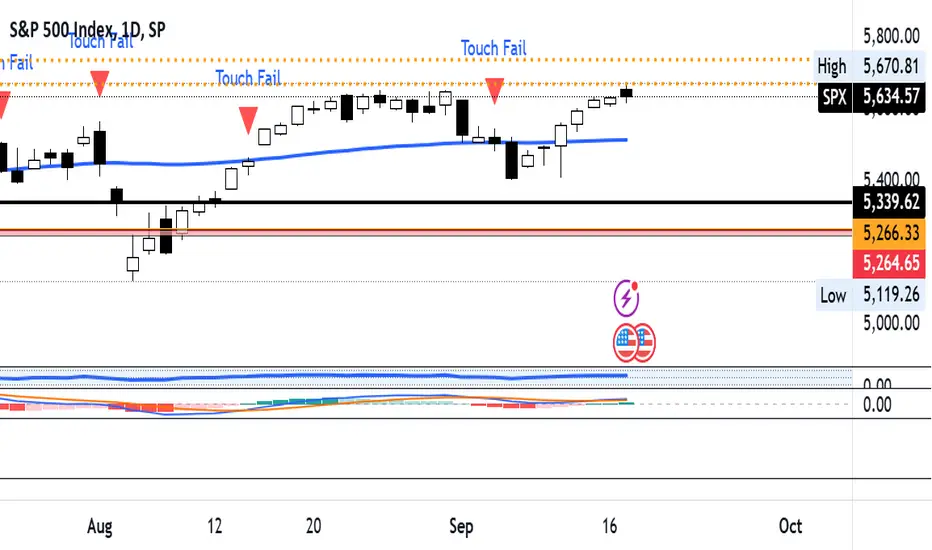
Overview: The Price Touches 50-Day MA and Fails to Cross Indicator is a powerful tool designed for traders and analysts using TradingView to monitor and identify key interactions between an asset's price and its 50-day Simple Moving Average (SMA). This indicator specifically highlights moments when the price touches the 50-day MA but fails to cross it, signaling potential support or resistance levels that could influence future price movements.
Key Features:
50-Day Simple Moving Average (SMA) Calculation:
Automatically calculates and plots the 50-day SMA on your chart, providing a clear reference point for price action analysis.
Touch Detection:
Identifies when the closing price comes within a user-defined tolerance (default is 0.1%) of the 50-day MA, indicating a "touch."
Failure to Cross Confirmation:
Determines if the price, after touching the MA, fails to cross it in the subsequent bar. This helps in recognizing potential reversal points or consolidation zones.
Visual Indicators:
Plots red downward triangles above the bars where a touch-and-fail event occurs, making it easy to spot these critical moments at a glance.
Customizable Touch Tolerance:
Allows users to adjust the sensitivity of touch detection by modifying the touch tolerance percentage, catering to different trading strategies and asset volatilities.
Alert Conditions:
Offers the option to set up alerts that notify you whenever a touch-and-fail event is detected, ensuring you never miss significant trading signals.
How It Works:
Calculating the 50-Day SMA:
The indicator computes the 50-day SMA using the closing prices, providing a smooth average that reflects the asset's mid-term trend.
Detecting a Touch:
A "touch" is registered when the absolute difference between the closing price and the 50-day SMA is less than or equal to the specified tolerance. This proximity suggests a potential support or resistance level.
Confirming Failure to Cross:
After a touch is detected, the indicator checks whether the price fails to move beyond the 50-day MA in the next bar. If the price remains on the original side of the MA, it signifies a failed attempt to cross, highlighting a possible reversal or consolidation.
Plotting Indicators:
When a touch-and-fail event is confirmed, a red downward triangle is plotted above the corresponding bar, providing a clear visual cue for traders.
Setting Up Alerts:
Users can enable alert conditions to receive real-time notifications whenever a touch-and-fail event is detected, allowing for timely trading decisions.
Customization Options:
Touch Tolerance (%):
Adjust the touch_tolerance input to set how close the price needs to be to the 50-day MA to be considered a touch. This flexibility allows the indicator to be tailored to different trading styles and asset behaviors.
Visual Styles:
Customize the appearance of the SMA line and the touch-fail indicators to match your charting preferences, ensuring seamless integration with your existing setup.
Benefits:
Enhanced Decision-Making:
By highlighting key interactions with the 50-day MA, this indicator aids in identifying potential entry and exit points, improving overall trading strategy.
Time Efficiency:
Automates the process of monitoring price movements relative to the 50-day MA, saving traders valuable time and reducing the need for constant manual analysis.
Versatility:
Suitable for various asset classes, including stocks, forex, commodities, and cryptocurrencies, making it a versatile tool for any trader's toolkit.
Happy Trading!
نص برمجي مفتوح المصدر
بروح TradingView الحقيقية، قام مبتكر هذا النص البرمجي بجعله مفتوح المصدر، بحيث يمكن للمتداولين مراجعة وظائفه والتحقق منها. شكرا للمؤلف! بينما يمكنك استخدامه مجانًا، تذكر أن إعادة نشر الكود يخضع لقواعد الموقع الخاصة بنا.
إخلاء المسؤولية
The information and publications are not meant to be, and do not constitute, financial, investment, trading, or other types of advice or recommendations supplied or endorsed by TradingView. Read more in the Terms of Use.