INVITE-ONLY SCRIPT
Mayfair Supply & Demand Zones 1.0
Identifying Supply and Demand zones can be tricky.
Just using price levels can mislead you, so why not include volume ramps to detect zones?
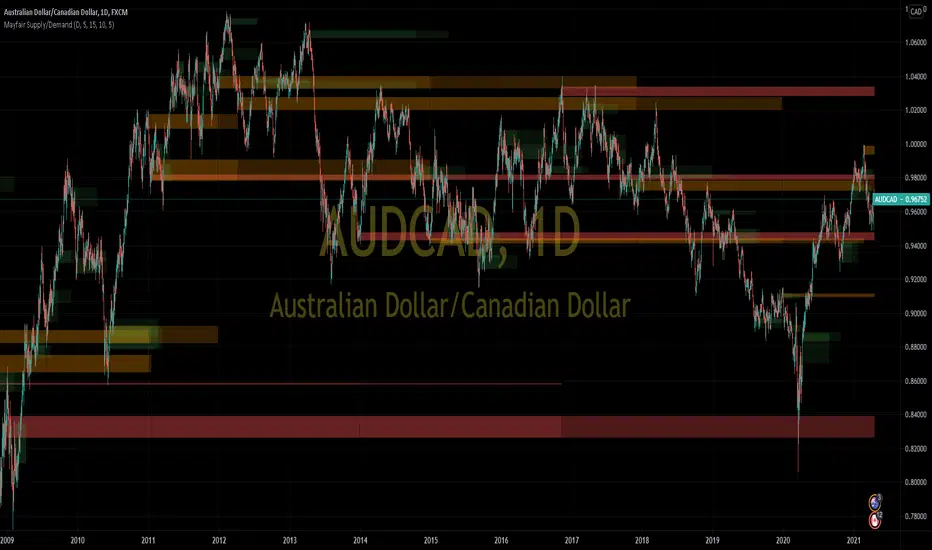
This indicator does it for you. It spots areas where volume has rapidly increased, measures the speed of the increase, and assigns three different levels of importance.
The red areas are the strongest zones, followed by amber, then green, like a traffic light.
The red areas are persisted longer than the amber, which are persisted longer than the green. As the persistence fades, the colour of the zone fades as well.
It is possible to set the levels of all three volume thresholds to suit yourself, as well as the lookback period the script uses to detect volume increases.
In this chart, only very large volume increases are used:

As you can see, the bands are narrower, but we feel the defaults give the best results.
Just using price levels can mislead you, so why not include volume ramps to detect zones?
This indicator does it for you. It spots areas where volume has rapidly increased, measures the speed of the increase, and assigns three different levels of importance.
The red areas are the strongest zones, followed by amber, then green, like a traffic light.
The red areas are persisted longer than the amber, which are persisted longer than the green. As the persistence fades, the colour of the zone fades as well.
It is possible to set the levels of all three volume thresholds to suit yourself, as well as the lookback period the script uses to detect volume increases.
In this chart, only very large volume increases are used:
As you can see, the bands are narrower, but we feel the defaults give the best results.
نص برمجي للمستخدمين المدعوين فقط
الوصول إلى هذا النص مقيد للمستخدمين المصرح لهم من قبل المؤلف وعادة ما يكون الدفع مطلوباً. يمكنك إضافته إلى مفضلاتك، لكن لن تتمكن من استخدامه إلا بعد طلب الإذن والحصول عليه من مؤلفه. تواصل مع Paul_Varcoe للحصول على مزيد من المعلومات، أو اتبع إرشادات المؤلف أدناه.
لا تقترح TradingView الدفع مقابل النصوص البرمجية واستخدامها حتى تثق بنسبة 100٪ في مؤلفها وتفهم كيفية عملها. في كثير من الحالات، يمكنك العثور على بديل جيد مفتوح المصدر مجانًا في نصوص مجتمع الخاصة بنا .
تعليمات المؤلف
″To buy this script please go to https://launchpass.com/mayfair-trading-and-mentoring/supply-and-demand
The script is quite CPU heavy, so it's best to hide it temporarily when scrolling or otherwise moving the chart
هل تريد استخدام هذا النص البرمجي على الرسم البياني؟
تحذير: يرجى القراءة قبل طلب الوصول.
إخلاء المسؤولية
لا يُقصد بالمعلومات والمنشورات أن تكون، أو تشكل، أي نصيحة مالية أو استثمارية أو تجارية أو أنواع أخرى من النصائح أو التوصيات المقدمة أو المعتمدة من TradingView. اقرأ المزيد في شروط الاستخدام.