PROTECTED SOURCE SCRIPT
تم تحديثه RSI SR by Kred-Allino
Hello Trader,
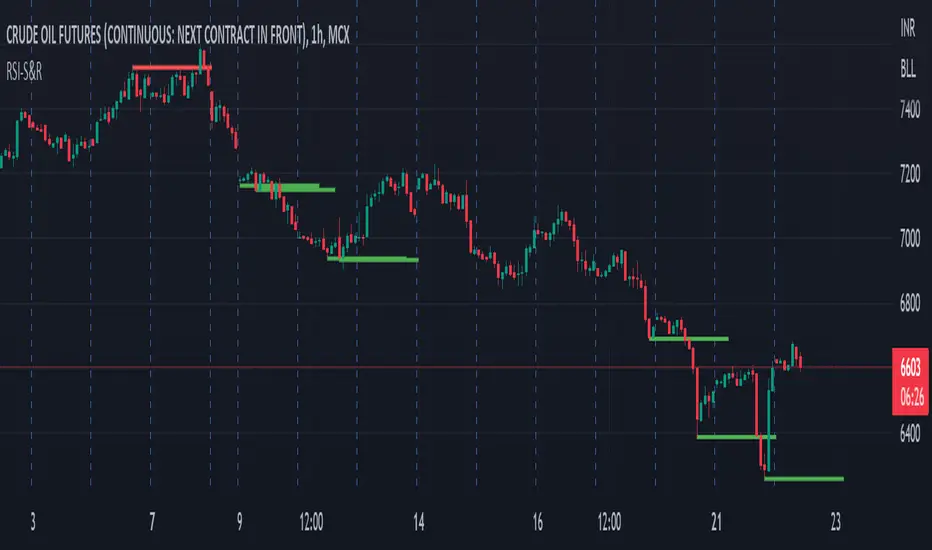
This indicator is draw Support & Resistance Level based on RSI Calculation, It will help you to find Support and Resistance very Easily.
Red Color Line - Resistance
Green Color Line - Support
RSI comes up from the OS region. So it's good time to do the calculation with.
- Find out the lowest RSI value from the RSI array
- Get the corresponding low price from the price array
- Get the corresponding bar_index from bar_index array
- Draw the demand/support line on that price
This Indicator is made for Educational Purpose only, Author will not liable for direct or indirect for any losses due to use of Indicator.
ملاحظات الأخبار
Color Changedنص برمجي محمي
تم نشر هذا النص البرمجي كمصدر مغلق. ومع ذلك، يمكنك استخدامه بحرية ودون أي قيود - تعرف على المزيد هنا.
إخلاء المسؤولية
لا يُقصد بالمعلومات والمنشورات أن تكون، أو تشكل، أي نصيحة مالية أو استثمارية أو تجارية أو أنواع أخرى من النصائح أو التوصيات المقدمة أو المعتمدة من TradingView. اقرأ المزيد في شروط الاستخدام.
نص برمجي محمي
تم نشر هذا النص البرمجي كمصدر مغلق. ومع ذلك، يمكنك استخدامه بحرية ودون أي قيود - تعرف على المزيد هنا.
إخلاء المسؤولية
لا يُقصد بالمعلومات والمنشورات أن تكون، أو تشكل، أي نصيحة مالية أو استثمارية أو تجارية أو أنواع أخرى من النصائح أو التوصيات المقدمة أو المعتمدة من TradingView. اقرأ المزيد في شروط الاستخدام.