PROTECTED SOURCE SCRIPT
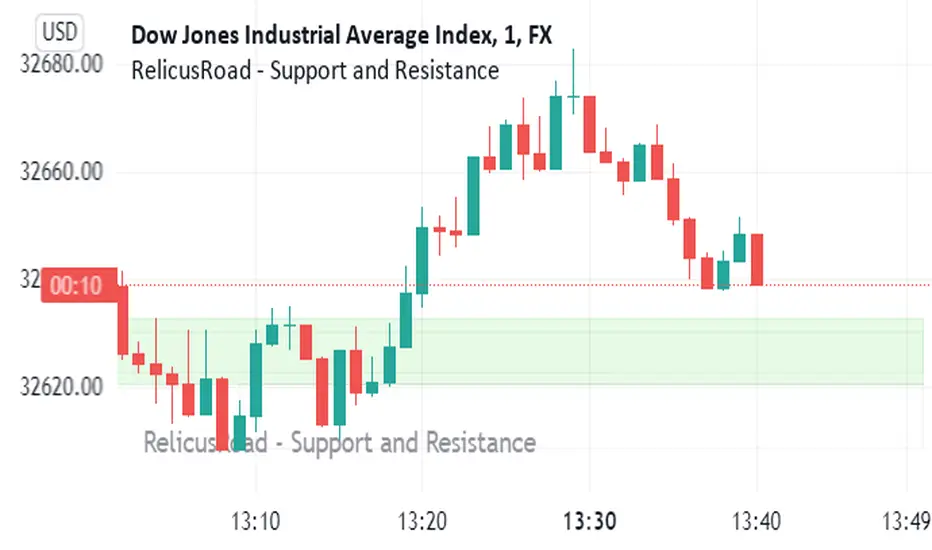
RelicusRoad - Support and Resistance

We bring you dynamically created fundamental support and resistance analysis required for any instrument a trader trades.

Support & Resistance Concept
The concepts of trading level support and resistance are undoubtedly two of the most highly discussed attributes of technical analysis . As part of analyzing chart patterns, these terms are used by traders to refer to price levels on charts that tend to act as barriers, preventing the price of an asset from getting pushed in a certain direction.
At first, the explanation and idea behind identifying these levels seem easy, but as you'll find out, support and resistance can come in various forms, and the concept is more difficult to master than it first appears, this is where RelicusRoad - Support and Resistance comes in and draws them for you.
- Technical analysts use support and resistance levels to identify price points on a chart where the probabilities favor a pause or reversal of a prevailing trend.
- Support occurs where a downtrend is expected to pause due to a concentration of demand.
- Resistance occurs where an uptrend is expected to pause temporarily, due to a concentration of supply.
- Market psychology plays a major role as traders and investors remember the past and react to changing conditions to anticipate future market movement.
- Support and resistance areas can be identified on charts using trendlines and moving averages.
نص برمجي محمي
تم نشر هذا النص البرمجي كمصدر مغلق. ومع ذلك، يمكنك استخدامه بحرية ودون أي قيود - تعرف على المزيد هنا.
Visit: relicusroad.com
Join: discord.gg/WApEq9Kr
Join: discord.gg/WApEq9Kr
إخلاء المسؤولية
لا يُقصد بالمعلومات والمنشورات أن تكون، أو تشكل، أي نصيحة مالية أو استثمارية أو تجارية أو أنواع أخرى من النصائح أو التوصيات المقدمة أو المعتمدة من TradingView. اقرأ المزيد في شروط الاستخدام.